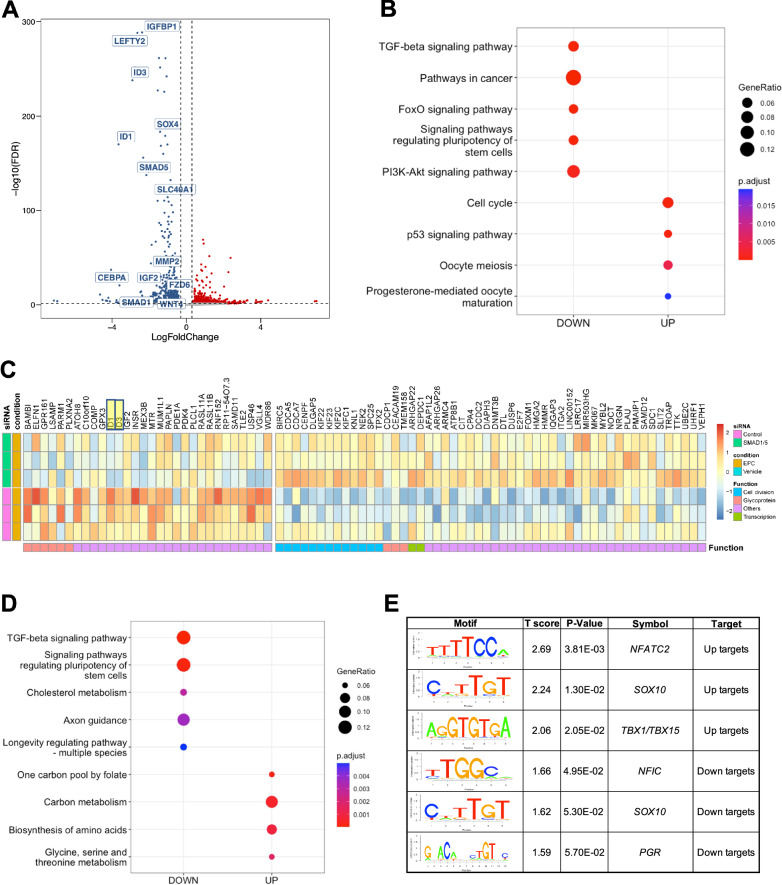
Fig. 5. Knockdown of SMAD1 and SMAD5 perturbs decidualization in endometrial stromal cells.
A Volcano plot showing the expression of differentially expressed genes in siCTL + EPC vs. siSMAD1/5 + EPC treated endometrial stromal cells (using a cutoff of Log 2 FC > 0.30, < −0.30, FDR < 0.05). Blue indicates genes that are down-regulated in siSMAD1/5 + EPC vs. siCTL + EPC, red indicates genes that are increased. (n = 1 individual without endometriosis). B Dot plot showing the enrichment of genes in key signaling pathways after SMAD1/5 knockdown. C Heatmap showing the expression and functional classification of key genes following SMAD1/5 knockdown + EPC versus siCTL + EPC treatment (n = 3 individuals without endometriosis). D The Binding and expression target analysis program was used to integrate SMAD4 binding peaks with the transcriptional changes after SMAD1/5 knockdown in EPC-treated endometrial stromal cells. Dotplot displays the gene ontology classification of genes that were activated by SMAD1/5 (i.e., were downregulated by SMAD1/5 and have a SMAD4 binding site). E Motif analysis was performed on the group genes identified to be SMAD1/5/4 direct targets and displayed as “uptargets” (genes that were increased after SMAD1/5 knockdown and had a SMAD4 peak) or as “downtargets” (genes that were downregulated after SMAD1/5 knockdown and had a SMAD4 peak).

