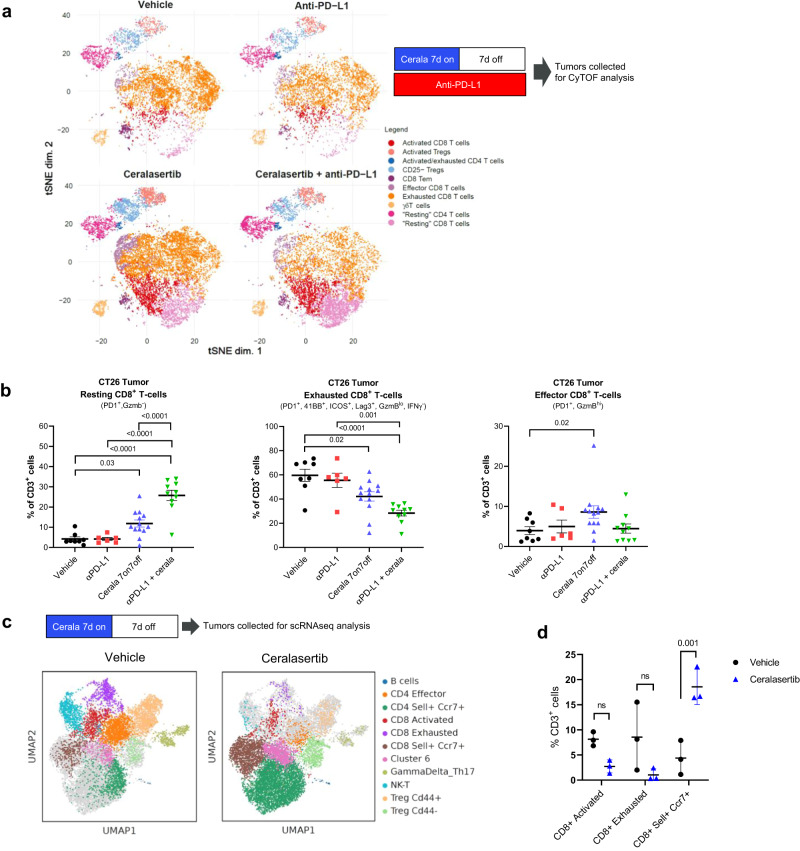
Fig. 3. Intermittent ATR inhibition reshapes the tumor immune microenvironment which promotes immunotherapy activity.
a, b CyTOF single cell immunophenotyping of CD45+CD3+ immune populations in subcutaneous CT26 tumors (n = 10 per group) of mice treated with 25 mg/kg b.i.d. ceralasertib, 10 mg/kg anti-PD-L1 b.i.w. or their combination at the end of a 7 days-on/7 days-off treatment cycle (day 14). a Study design and t-SNE plots visualization of high level unbiased clustering analysis of CD3+ T-cell populations classified by cell surface marker expression as indicated. b Quantification of the proportions of resting, exhausted or effector CD8+ T-cell populations as a percentage of total CD3+ cells which were significantly modulated following treatment compared to vehicle control. Individual tumor values, group mean and SEM are shown. Statistical analysis performed by β-regression (R). c, d Single cell RNAseq analysis of CD3+ cells isolated from the tumors at the end of a 7 days-on/7 days off 25 mg/kg b.i.d. ceralasertib monotherapy treatment cycle (day 14) in CT26 tumors (n = 3 per group). c Study design and UMAP plot visualization of transcriptomic profiles of CD3+ expressing cells according to Leiden clustering. d Proportions of CD8+ T-cells populations as a percentage of the total CD3+ expressing cells per Leiden cluster vehicle and ceralasertib. Individual tumor values and group mean and SEMs are shown. Statistical analysis performed by one-way ANOVA with correction for multiple comparisons. In all panels ns means not significant (p > 0.05). P values are shown on the graphs. Source data are provided as a Source Data file.

