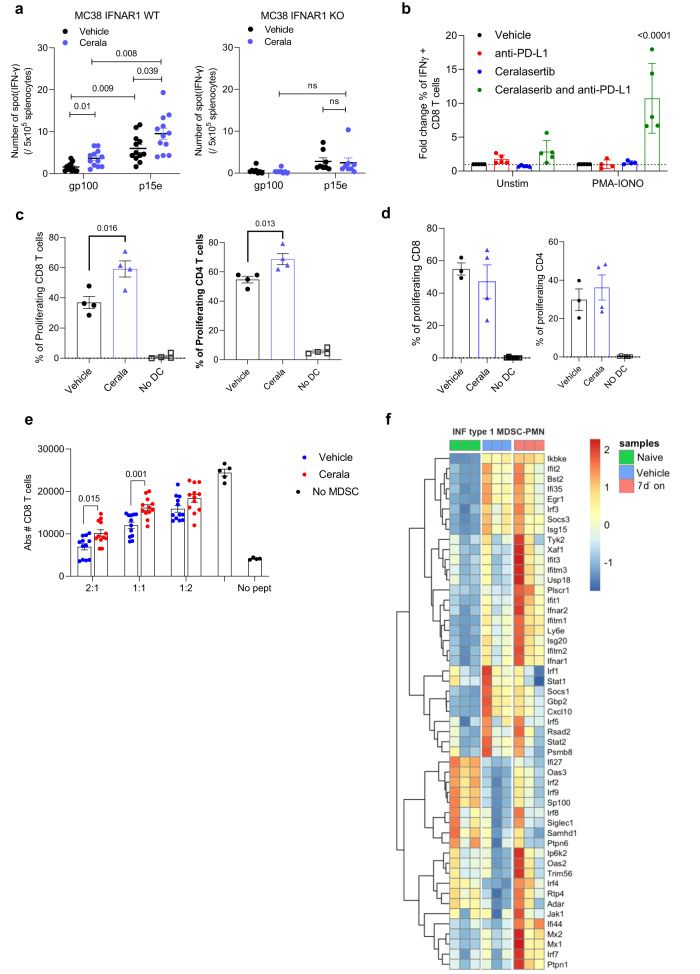
Fig. 7. IFNI signaling regulates tumor-specific T-cells.
a WT or IFNAR1 KO mice were implanted with MC38 tumor cells s.c. and treated with 25 mg/kg b.i.d. ceralasertib. Splenocytes were restimulated with tumor-specific (p15e) or irrelevant peptides (mGp100). Number of IFN-γ spots are shown. N = 12 WT, N = 6 IFNAR1 KO. Individual mouse results, mean and SEM are shown. Two-sided unpaired Student’s t-test was used. NS—non-significant (p > 0.05). b T-cells isolated from LN of mice treated with 10 mg/kg anti-PD-L1, 25 mg/kg b.i.d. ceralasertib, or combination were plated in the presence of feeder of control splenocytes, restimulated for 6 h with cell-stimulation cocktail, and stained for intracellular IFN-γ. Fold increase of % of IFN-γ+ cells within CD8+ T-cells is shown. N = 5. Individual mouse results, mean and SEM are shown. One-way ANOVA with correction for multiple comparisons was used. Non-significant p values (p > 0.05) are not shown. c DC were isolated from LN of MC38-bearing mice (C57BL/6) treated with 25 mg/kg b.id. ceralasertib and plated with BALB/c derived splenocytes labeled with Cell Trace Far-Red at a 1:5 (DC:splenosytes) ratio. After 5 days proliferation of CD8+ and CD4+ T-cells was measured by Cell-Trace dilution. N = 4. Individual mouse results, mean and SEM are shown. Two-sided unpaired Student’s t-test was usede. d Experiments were performed as in (c) except DC were isolated from LN of IFNAR1 KO MC38-bearing mice. N = 3—vehicle group, N = 4—Cerala group, N = 6—no DC group. Individual mouse results, mean and SEM are shown. e PMN-MDSC were isolated from tumors of mice treated for 7 days with 25 mg/kg b.i.d. ceralasertib and plated at different ratios with PMEL splenocytes in the presence of specific peptide. After 48 h the number of CD8+ T-cells was calculated by flow cytometry. N = 10. Individual mouse results, mean and SEM are shown. Two-sided unpaired Student’s t-test was used. Non-significant (p > 0.05) p values are not shown. f IFNI signature heatmap evaluated in PMN from naïve mice (N = 3), tumor PMN-MDSC isolated from mice treated with vehicle (N = 3) or with 25 mg/kg ceralsertib for 7 days (N = 3). Source data are provided as a Source Data file.

