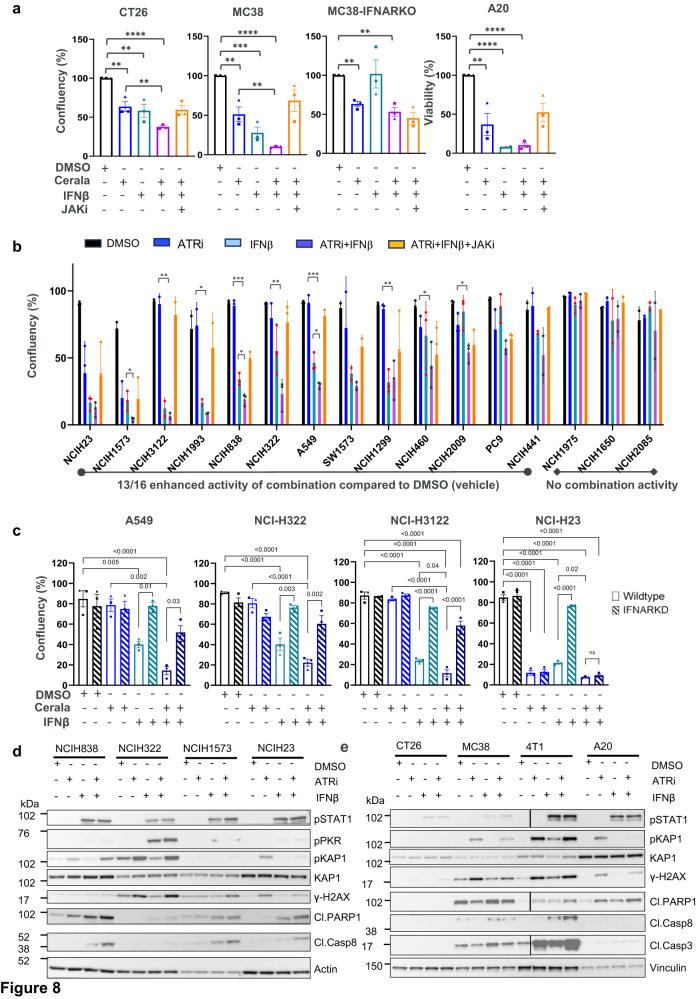
Fig. 8. IFN signaling enhances the response of the ceralasertib by inducing apoptosis in some cell lines.
a, b Growth inhibition activity of monotherapy ceralasertib (1 μM) or IFN-β (1 ng/ml) or the combination with and without the presence of JAK inhibitor (5 μM). a mouse syngeneic cancer cell lines, including isogenic MC38 (IFNAR1 intact) and MC38 IFNAR1 knockout (KO) pairs. Bars show mean and SEM of three biological replicates where each replicate is represented as a symbol. b 16 human NSCLC cell lines. Bars show mean and SEM for three biological replicates. Statistical analysis comparing ceralasertib vs ceralasertib+IFN-β or IFN-β vs ceralasertib+IFN-β was performed by two-sided unpaired Student’s t-test and indicated on the graphs for each cell line. Asterisk are shown to maintain readability of the graphs. *p < 0.05, **p < 0.01, ***p < 0.001, ****p < 0.0001. Full statistical comparisons are in Supplementary Fig. 17C. c Growth inhibition activity of ceralasertib (0.3 μM) or IFN-β (1 ng/ml) or the combination in parental NSCLC cell lines with IFNAR1 (Wild-type) compared toIFNAR1 siRNA knockdown (IFNAR KD) cells. Bars show mean and SEM of three biological replicates where each replicate is represented as a symbol. Statistical analysis was performed by two-sided unpaired Student’s t-test. Asterisk are shown to maintain readability of the graphs. *p < 0.05, **p < 0.01, ***p < 0.001, ****p < 0.0001. Western blot assessing target engagement and apoptosis markers following 24 h of indicated treatments in (d), human NSCLC cell lines and (e), mouse cancer syngeneic cell lines. Two experiments with the same results were performed. Source data are provided as a Source Data file.

