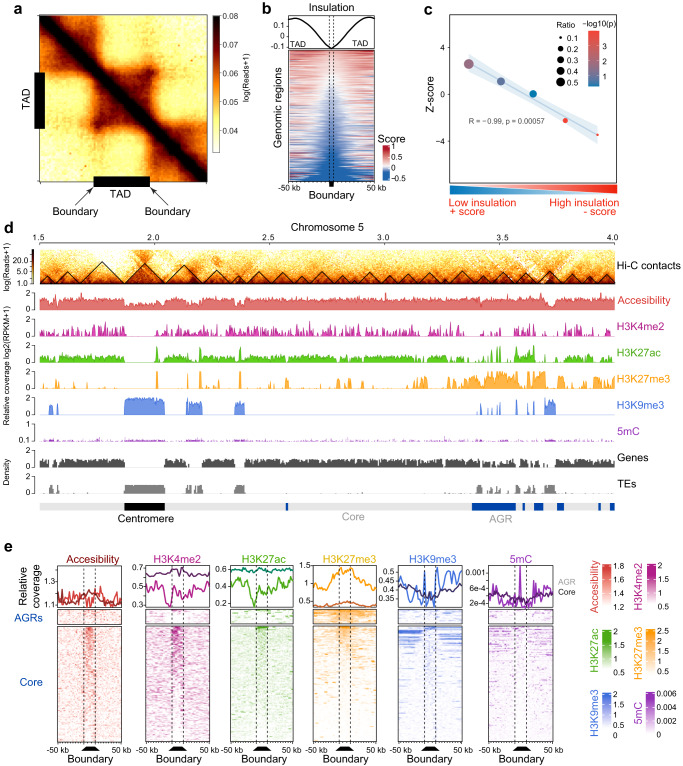
Fig. 1. The Verticillium dahliae genome is organized in topological associating domains (TADs).
a Hi-C contact matrix showing local interaction frequency, aggregated over predicted TADs (black bars) with 50 kb up- and downstream sequence. The drop in intensity at boundaries at either edge of the TADs indicates stronger interaction within TADs than with neighboring genomic regions. b Heatmap showing the physical interaction strength (insulation score) centered over boundaries with 50 kb up- and downstream sequence as rows, ordered on insulation score with weakest insulated boundaries on top. The top plot displays the average of the insulation scores in the heatmap below. c TADs in AGRs are weaker insulated when compared with core genome TADs. The X axis indicates quintiles of boundaries, separated based on insulation scores. The Y axis indicates z-score and the −log10(P value) color-scale after a one-sided permutation test for enrichment of boundaries in AGRs (10,000 iterations). The plot displays a linear regression (blue line) and confidence interval (light blue) as well as the R and P value for the linear regression. d TAD distribution in V. dahliae strain JR2, exemplified by a section of chromosome 5. From top to bottom: Hi-C contact matrix depicting TADs as black triangles, open chromatin determined with ATAC-seq, histone modifications H3K4me2, H3K27ac, H3K27me3, and H3K9me3 normalized over a micrococcal nuclease digestion control, GC methylation, as well as gene and transposable element (TE) densities in 10 kb windows. Adaptive genomic regions (AGRs) and the centromeric region are indicated in blue and black, respectively. e Chromatin characteristics are differentially associated with TAD boundaries in the core genome and in AGRs. On top, the distribution of each chromatin feature centered for boundaries (dashed lines) with 50 kb up- and downstream sequence, for the core genome (dark line) and AGRs (light line). On the bottom, the corresponding heatmaps are shown. Source data are provided as a Source Data file 1.

