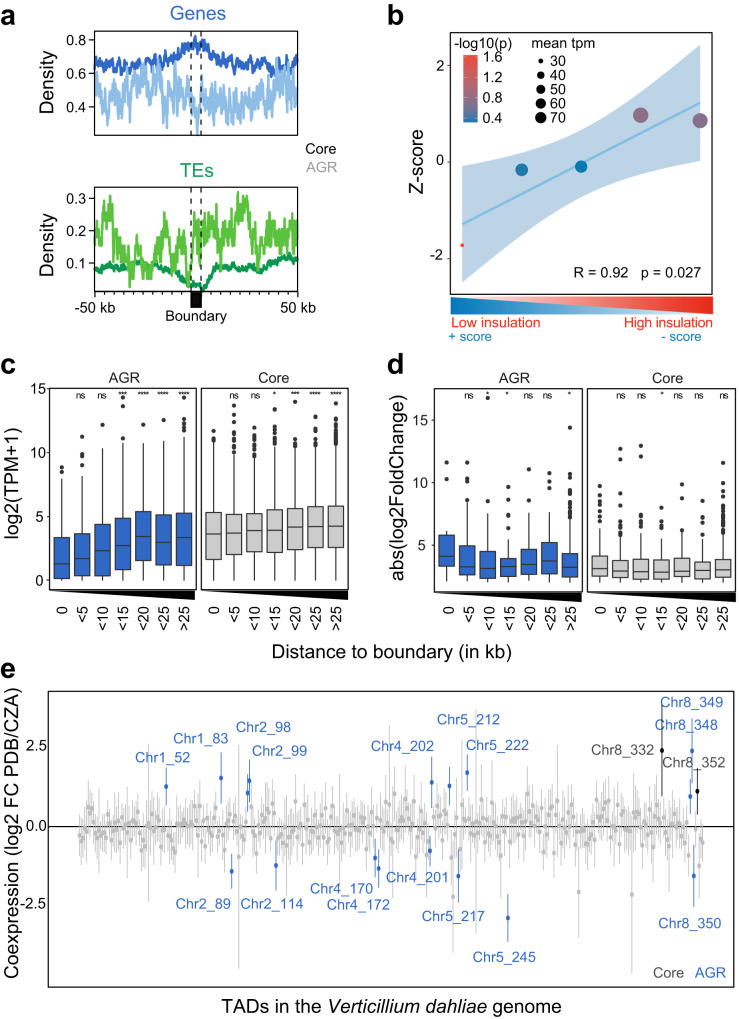
Fig. 2. TAD organization is associated with transcription in Verticillium dahliae.
a Average density of genes and transposable elements (TEs) per 1 kb window centered over boundaries with 50 kb up- and downstream sequence in the core genome and in adaptive genomic regions (AGRs) of V. dahliae strain JR2. The core genome (dark line) and in AGRs (light line). b Genes in lowly insulated boundaries are lower expressed than those in more highly insulated boundaries. Association between TAD boundary quintiles, separated on insulation score, and transcription of genes located in TAD boundaries. The Y axis depicts the z-score, color of the datapoints indicates the −log10(P value) after a one-sided permutation test (10,000 iterations) and size of datapoints indicates mean transcription value (TPM) of represented genes. A linear regression (blue line), with 95% confidence interval (light blue), between boundary quintiles is displayed. c Transcription values for V. dahliae cultivated for 6 days in potato dextrose broth (PDB) and d absolute log2-fold change in expression between cultivation in PDB or in Czapec-Dox medium (CZA), for all genes grouped based on their distance to the closest boundary in the core genome (gray) or in AGRs (blue). Statistically significant differences in average transcription level for the distance groups was compared to the group of genes located in boundaries (distance 0) and determined by the one-sided Wilcoxon rank-sum test (*P<=0.05, **P < =0.01, **P < =0.001, ****P < =0.0001). Black lines in the boxes depict the median, boxes extend from first to third quartile, vertical lines indicate the 1.5× interquartile range and dots depict outliers for each category. Normalized mean of biologically independent experiments n = 3 is shown. e Linear regression effect size of each TAD on differential gene expression between cultivation for 6 days in PDB or in CZA. Mean effect size of each TAD is shown as a point, with 95% confidence interval, and TADs with a significant effect (95% confidence interval is significantly different from 0) are shown in color and labeled by corresponding chromosome and TAD number, for TADs in the core genome (black labels) and in AGRs (blue labels). Normalized mean of biologically independent experiments n = 3 is shown. Source data are provided as a Source Data file 2.

