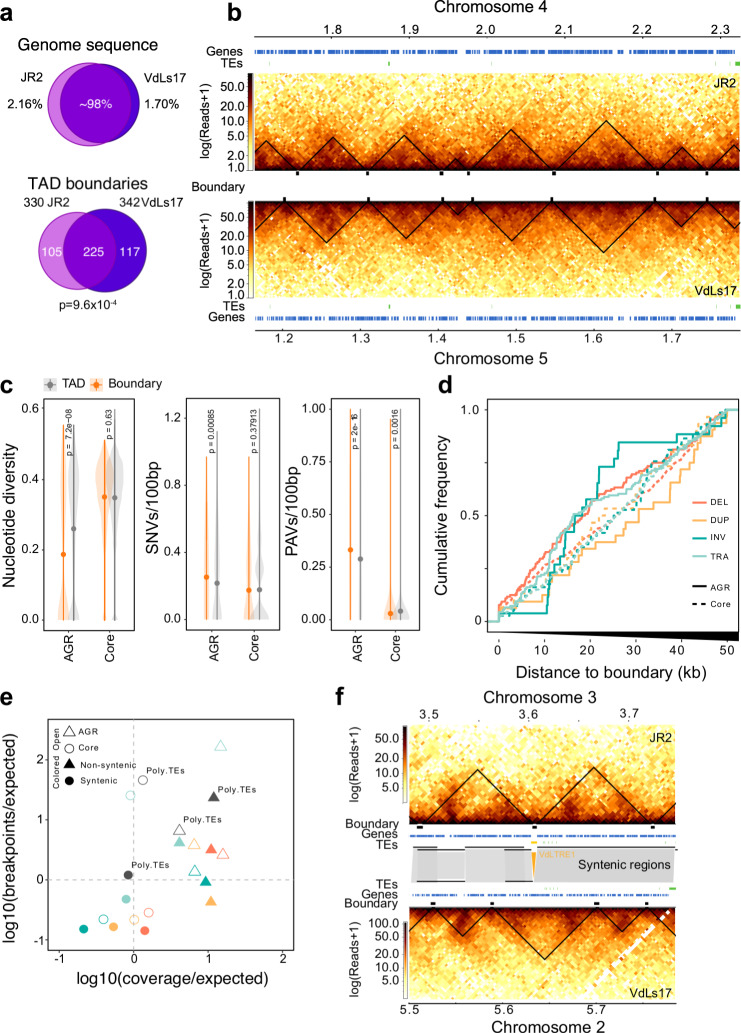
Fig. 3. Topological associating domain (TAD) organization is conserved in Verticillium dahliae.
a Top: V. dahliae strains JR2 and VdLs17 are highly similar as 97.84% and 98.30% of their respective genomes are syntenic. Bottom: Most of the TAD boundaries overlap between JR2 and VdLs17. P value after one-way Fisher’s exact test. b Syntenic block between JR2 chromosome 4 and VdLs17 chromosome 5 shows conserved distribution of TADs and boundaries. Heatmaps represent contact matrixes of JR2 (top) and VdLs17 (bottom) with TADs (black triangles). Genes and transposable elements (TEs) are displayed above and below. c Boundaries are not enriched for genomic variation in a set of 42 V. dahliae strains. Nucleotide diversity, single nucleotide variants (SNVs), presence/absence variation (PAVs). TADs n = 277, 76 for core genome and AGRs, respectively. Boundaries n = 308, 39 for core genome and AGRs, respectively. P values based on a one-way Wilcoxon rank-sum test. Center dot depict the median; line ranges depict the upper and lower 1.5× interquartile range. d Cumulative frequency plot of structural variant (SV) breakpoints over distance from boundaries in the core genome (dashed line) and in AGRs (solid line), overlaps with boundaries (distance = 0) are included. SVs are separated in deletions (DEL, orange), duplications (DUP, yellow), inversions (INV, green) and translocations (TRA, blue)23. e TAD boundaries in AGRs and in the core genome contain more and fewer SVs than expected by chance, respectively. SVs in boundaries in the core genome (open circles) and in AGRs (open triangles) are indicated, as well as in boundaries in syntenic (solid circles) and non-syntenic (solid triangles) genomic regions and in polymorphic TEs (gray circles). f Synteny breaks associated with transposable elements affect TAD organization. Heatmaps represent contact matrixes of JR2 (top) and VdLs17 (bottom) with TADs (black triangles), and TADs, genes and TEs are displayed in-between. Syntenic regions are indicated as gray blocks. A VdLTRE1 insertion in strain JR2 is indicated in yellow. Source data are provided as a Source Data file 3.

