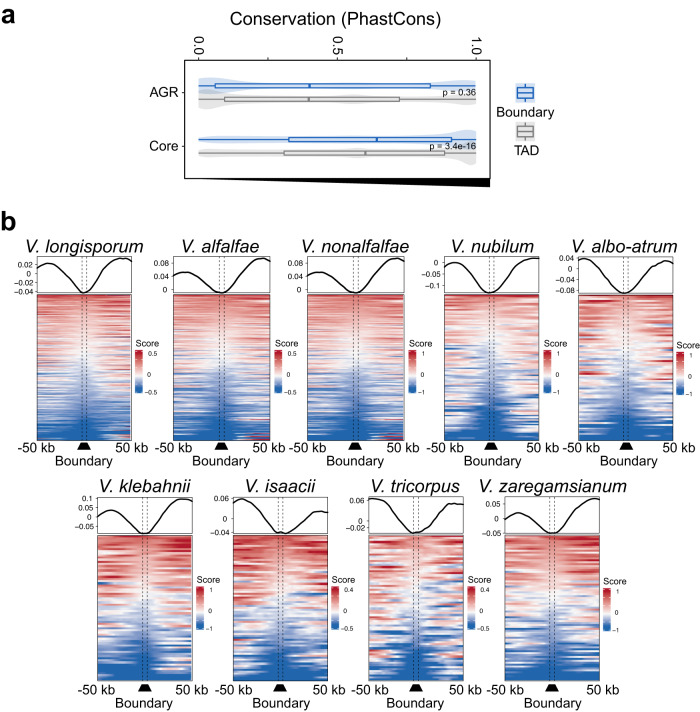
Fig. 4. TAD boundaries show signs of conservation in the Verticillium genus.
a TAD boundaries are more conserved than TADs. Boxplots display the conservation score of each TAD (gray) and boundary (blue) in the core genome and in AGRs. TADs n = 277, 76 for core genome and AGRs, respectively. Boundaries n = 308, 39 for core genome and AGRs, respectively. P values based on a one-way Wilcoxon rank-sum test. Boxplots depict center line, median; box limits, upper and lower quartiles; whiskers, 1.5× interquartile range. b Insulation score over TAD boundaries predicted by the sequence-based method, with 50 kb up- and downstream sequence, for each Verticillium species. Line plots display average signals over boundaries and up/downstream sequence, bottom plots display predicted boundaries in rows, ordered by insulation scores for each independent experiment. Source data are provided as a Source Data file 4.

