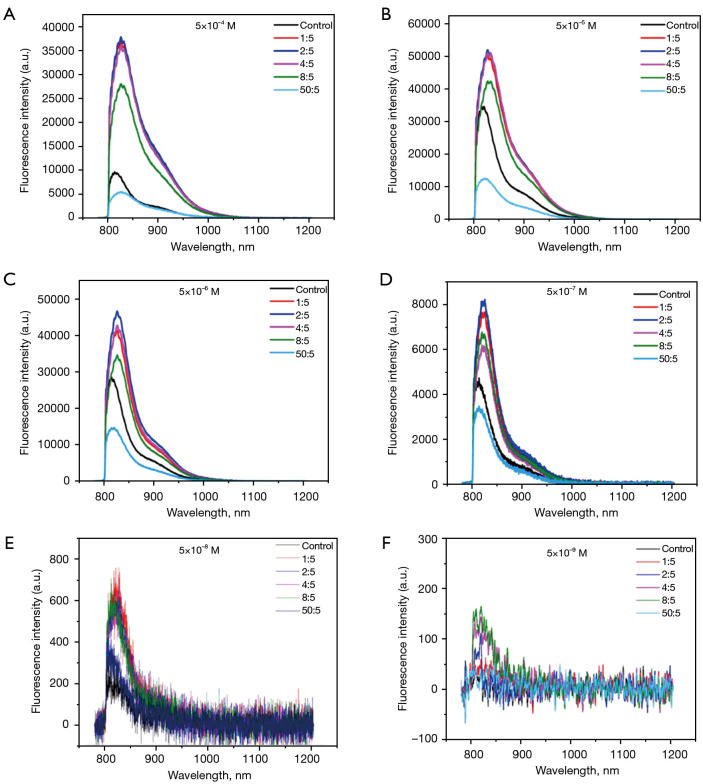
Figure 2.
Fluorescence spectrum of ICG and HSA at different concentrations and ratios. (A) ICG concentration of 5×10⁻⁴ M; (B) ICG concentration of 5×10⁻⁵ M; (C) ICG concentration of 5×10⁻⁶ M; (D) ICG concentration of 5×10⁻⁷ M; (E) ICG concentration of 5×10⁻⁸ M; (F) ICG concentration of 5×10⁻⁹ M. ICG, indocyanine green; HSA, human serum albumin.

