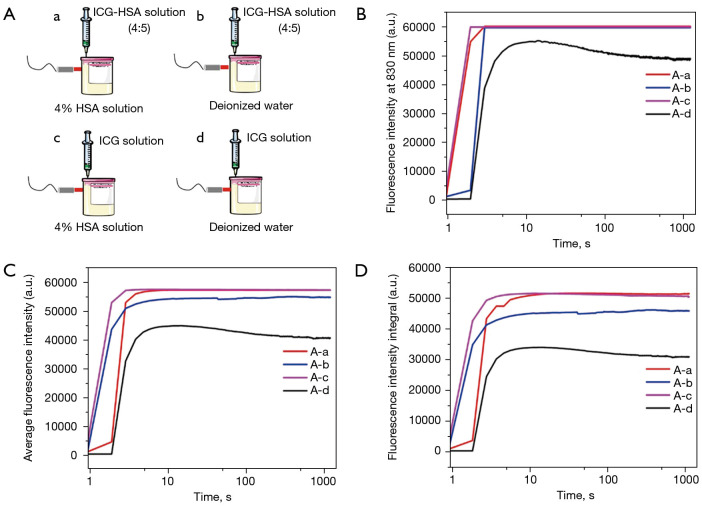
Figure 4.
Dynamic time series fluorescence spectrum. (A) Four different transient injection groups; (B) fluorescence intensity at 830 nm over time; (C) mean fluorescence intensity at 800–860 nm over time; (D) fluorescence intensity integral at 800–900 nm over time. A-a: ICG-HSA (4:5) injection was injected into a 4% HSA solution; A-b: ICG-HSA (4:5) injection was injected into deionized water; A-c: ICG solution was injected into a 4% HSA solution; A-d: ICG solution was injected into deionized water. ICG, Indocyanine green; HSA, human serum albumin.

