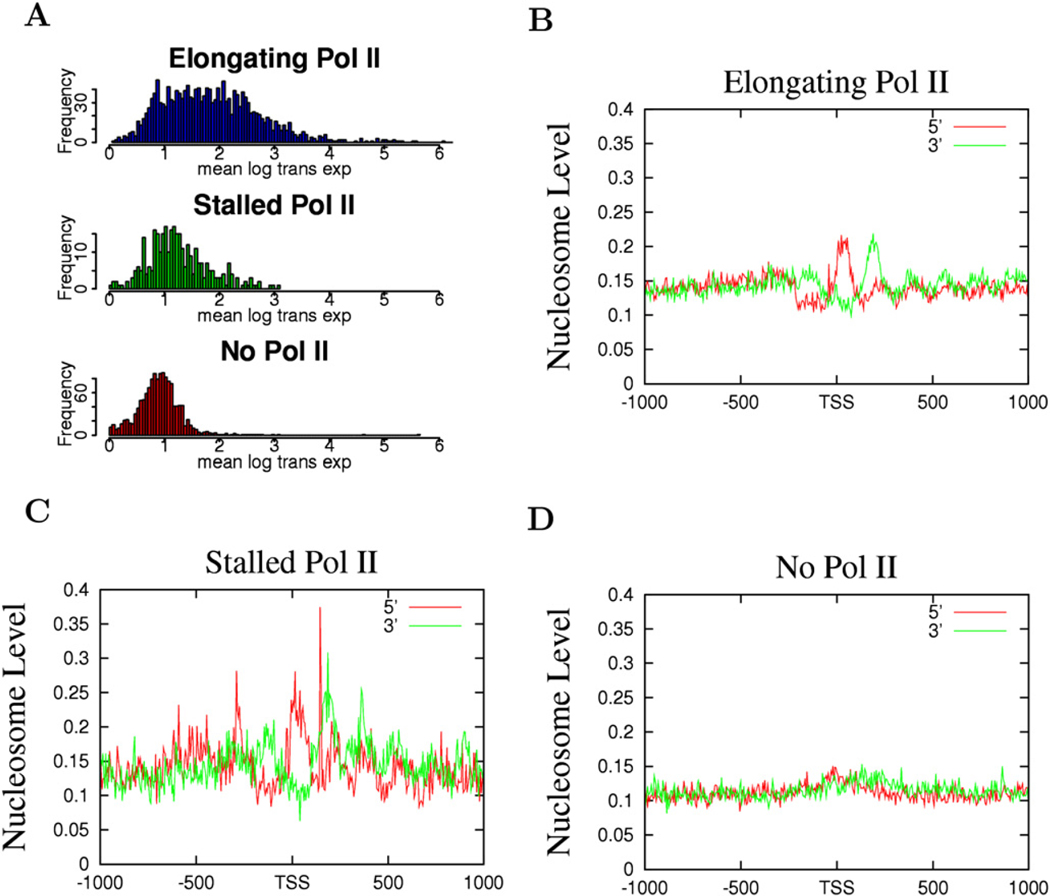
Figure 3. Promoters with Stalled Pol II Exhibit Similar Patterns of Nucleosome Phasing to the Promoters with Elongating Pol II.
(A) Expression patterns of the genes with elongating, stalled, or no Pol II (see Experimental Procedures for details). The y axis indicates the number of genes exhibiting the expression level shown by the x axis.
(B) The nucleosome pattern near the TSS of the genes with elongating Pol II. The y axis shows the normalized number of sequence tags from the sense strand (red) and antisense strand (green) of DNA at each position.
(C) The nucleosome pattern near the TSS of the genes with stalled Pol II in the promoter region.
(D) The nucleosome pattern near the TSS of the genes without any Pol II binding in the promoter region.

