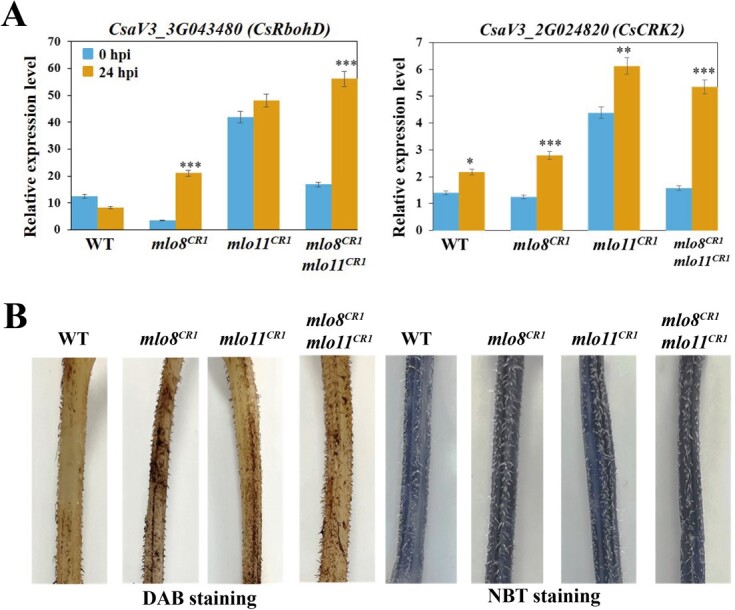
Figure 5.

Changes in ROS accumulation in stems of CsMLO mutants and WT after PM infection. a Relative expression levels of CsRbohD and CsCRK2 at 0 and 24 hpi *P < 0.05, **P < 0.01, ***P < 0.001, ANOVA, Student’s t-test. b Stems harvested at 6 dpi were stained. Blue and brown precipitate indicates O2− and H2O2 location and content.
