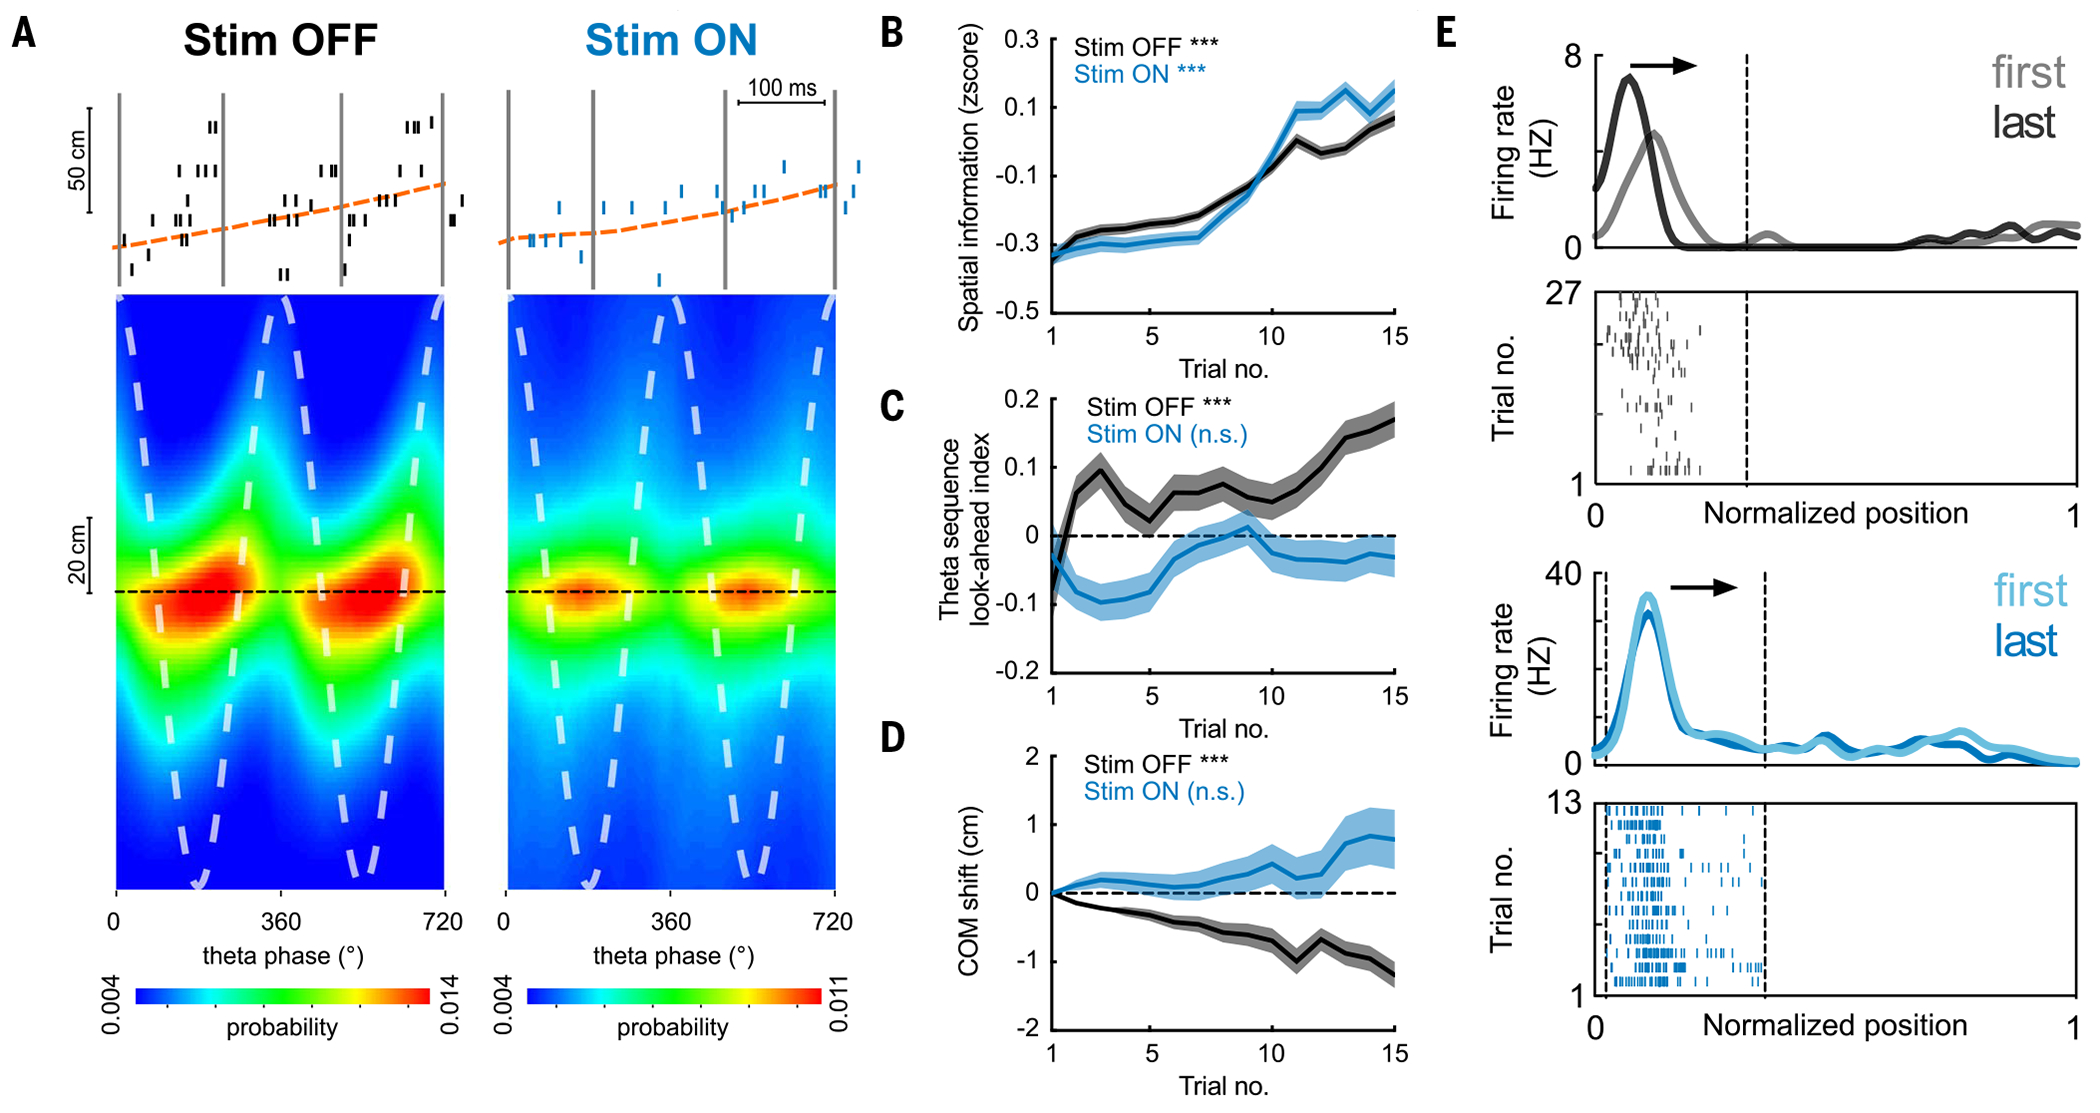
Fig. 3. Impaired development of place cell theta sequences and predictive properties.

(A) (Top) Example theta sequences. (Bottom) Average (n = 20 sessions in five rats) decoded position estimated across different theta phases, relative to the actual animal position (dashed black line). Stim ON theta sequences were impaired (Stim OFF versus Stim ON quadrant scores: P = 7 × 10−141; weighted correlation: P = 4 × 10⁻²², Wilcoxon rank sum test, n = 17,992/13,265 theta cycles). (B) Increase in spatial information of place cells across laps in both Stim ON (blue) and Stim OFF (black) conditions (***P = 1.8 × 10⁻¹¹/1.2 × 10−5 for Stim OFF/ON, Wilcoxon rank sum tests comparing the 1st versus the 15th lap). (C) Increase in theta sequence look-ahead index in the Stim OFF (***P = 4.0 × 10⁻⁶), but not the Stim ON, direction (P = 0.71, Wilcoxon signed-rank tests). (D) Backward shifting of PF center-of-mass (COM) overlaps on the Stim OFF trajectory (***P = 1.3 × 10−69) but not the Stim ON trajectory (P = 0.16, Wilcoxon signed-rank tests). COM shift relative to the first lap is shown (>0, forward shifting to future; < 0, backward shifting to past). (E) Example place cells showing backward shifting place fields on the Stim OFF trajectory (top) and stable fields on the Stim ON trajectory (bottom). Arrows depict the animal’s running direction. Curves on top show smoothed firing rate for the first and last laps, and raster plots below show spikes across all laps. For all these analyses, n = 20 sessions from five rats were used.
