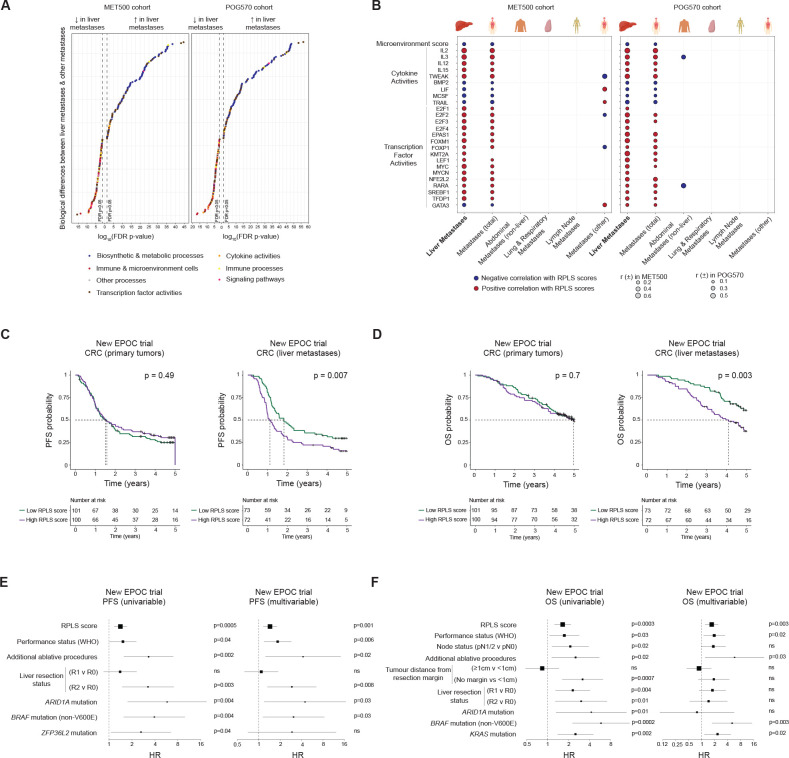
Figure 6.
Pathobiological associations and predictive potential of the RPLS signature in liver metastases. (A) Differential expression of pathways and processes (ssGSEA with KEGG and Hallmarks gene lists) between liver metastases and other metastases in MET500 (n=490) and POG570 (n=438) cohorts (p values derived from Wilcoxon test). (B) Biological processes uniquely associated with the RPLS signature in liver metastases. (C, D) Kaplan-Meier survival curves with log-rank statistics of primary colorectal cancer tumours (n=204) and liver metastases (n=145) stratified by RPLS score (above and below median) for (C) progression-free survival and (D) overall survival in the New EPOC trial. (E–F) Univariable and multivariable Cox proportional hazards analysis of RPLS scores and other significant clinicogenomic variables for (E) progression-free and (F) overall survival. ns, not significant.

