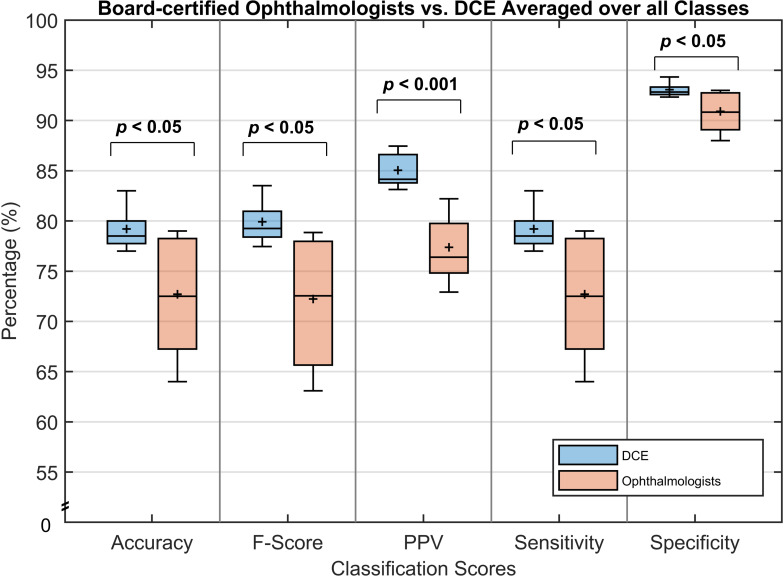
Figure 3.
Classification scores for both the DCE and ophthalmologists over all 100 test set images and four classes. Box plots include a horizontal solid line and solid cross indicating the median and mean values, respectively, for each score. P values less than 0.05 are indicated, as determined by a two-sample t-test. DCE, deep convolutional ensemble; PPV, positive predictive value.

