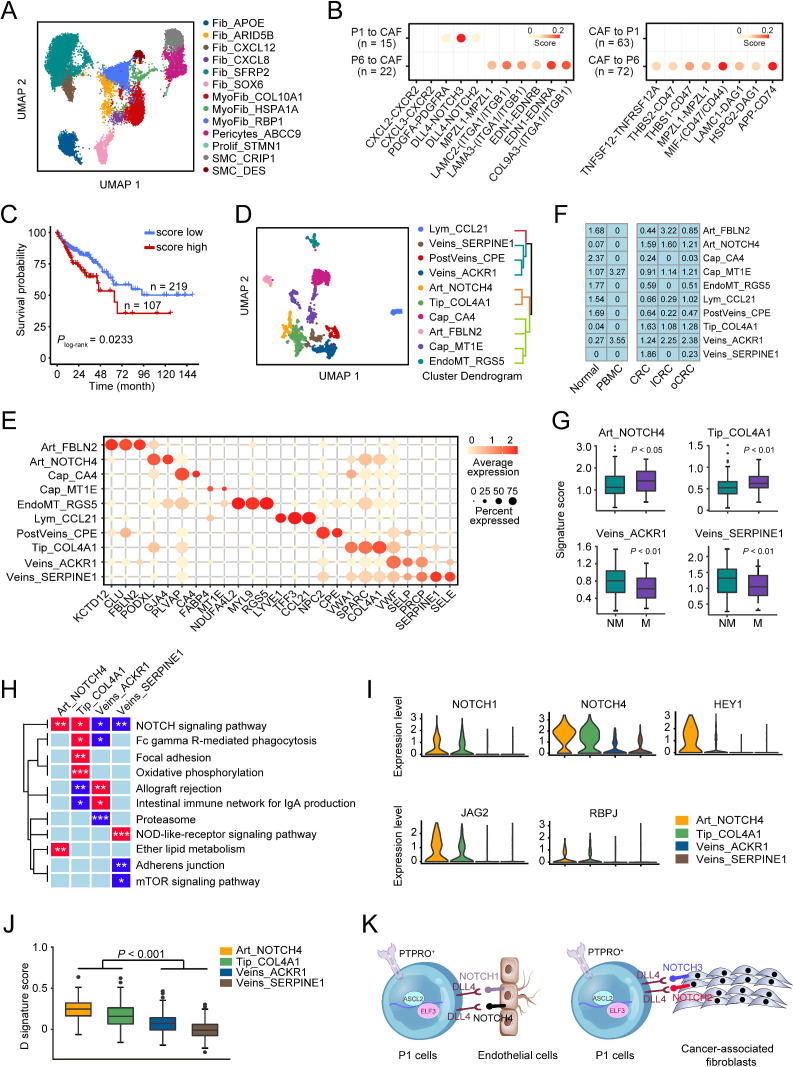
Figure 6.
Interactions of stem-like cells with CAFs and differentiated endothelial cells in colorectal cancer (CRC) metastasis. (A) UMAP plot of 13 fibroblast cell subtypes. (B) Selected ligand-receptor pairs between CAFs and P1/P6 cells in primary CRC. (C) Kaplan-Meier estimation of survival time of patients with microsatellite stable CRC in The Cancer Genome Atlas (TCGA)-COAD dataset based on the score of P1-CAFs interactions. (D) UMAP plot of 10 endothelial cell subtypes (left panel) and hierarchical clustering of these endothelial cell subtypes (right panel). (E) Bubble heatmap showing expression levels of selected markers in different endothelial cell subtypes. Dot size indicates the fraction of expressing cells and the colours indicate the normalised expression level. (F) Tissue prevalence of endothelial cell subtypes estimated by Ro/e score. (G) The signature scores of four endothelial cell subtypes in patients with or without CRC metastases. Data were from TCGA-COAD dataset. P values by Wilcoxon rank-sum tests. (H) Heatmap of the gene expression levels in some pathways in four endothelial cell subtypes. (I) The differential expression levels of some genes in the NOTCH signalling pathway in four endothelial cell subtypes. (J) The comparison of the D signature score of differentiated endothelial cells in four endothelial cell subtypes. P values by Wilcoxon rank-sum tests. (K) The network involved in DLL4-NOTCH ligand-receptor pairs between P1 and CAFs or Art_NOTCH4/Tip_COL4A1.

