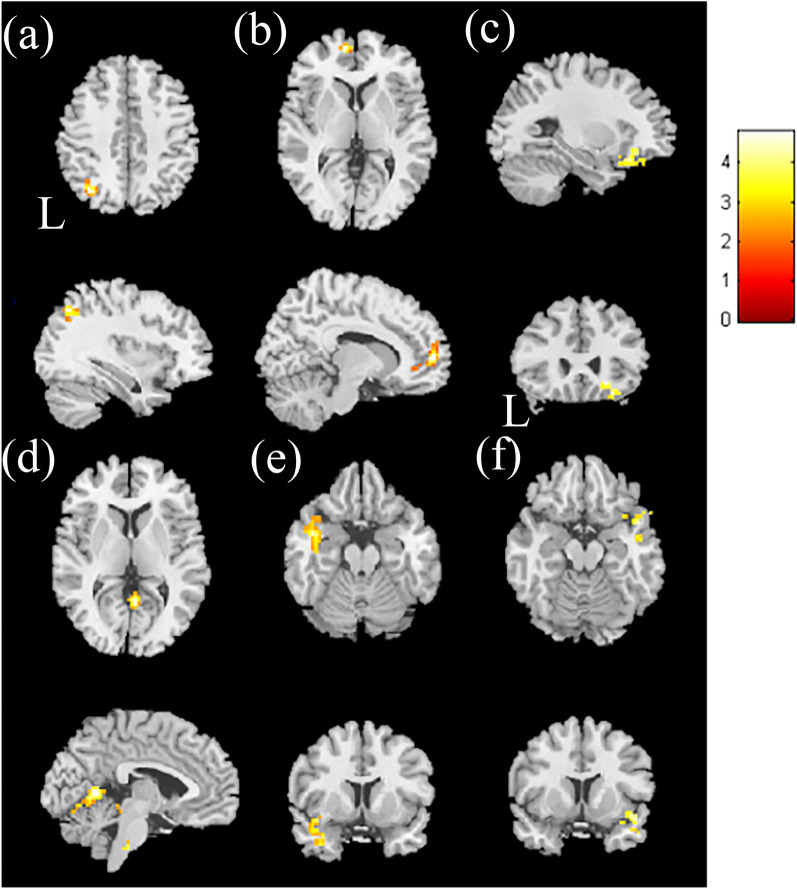
Figure 1.
The two-sample t-test results of higher mfALFF in hypertensive patients compared with healthy controls. Higher mfALFF was found in the (a) left superior parietal lobule, (b) left medial frontal gyrus, and (c) right inferior frontal gyrus in the HTN group than in the HC group, with corrected p < 0.02 and cluster size > 50. The two-sample t-test results of lower mfALFF in hypertensive patients compared with healthy controls. Lower mfALFF was found in the HTN group than in the HC group in the (d) right posterior cingulate gyrus, (e) left superior temporal gyrus, and (f) right superior temporal gyrus, with p < 0.02 and cluster size > 100. The color bar indicates the t-score.

