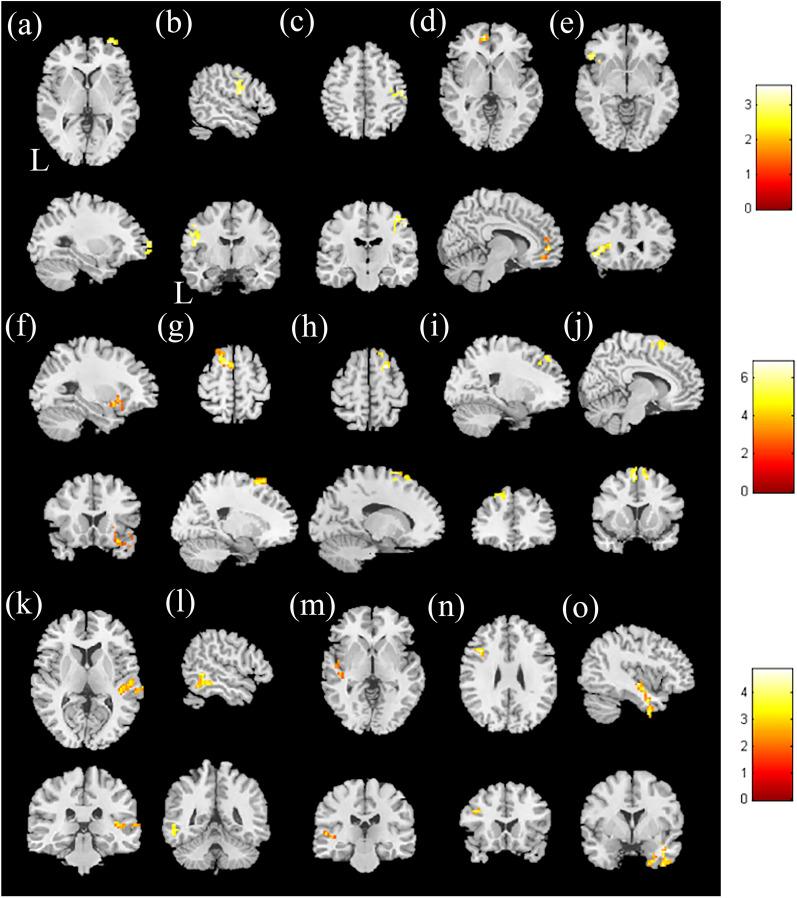
Figure 3.
Correlation between CVVLT and mfALFF in the HTN group. The t-score of t-statistics and scatter plot indicate a positive correlation in the (a) right superior frontal gyrus, (b) left precentral gyrus, and (c) right postcentral gyrus. The correlation between the CVVLT and mReHo in the HTN group. The t-score of the t-statistics and scatter plot indicate a positive correlation in the (d) left medial frontal gyrus and (e) left inferior frontal gyrus, with p < 0.02 and cluster size > 40. The correlation between TMT and mfALFF in the HTN group. The t-score of t-statistics and scatter plot indicate a positive correlation in the (f) right inferior frontal gyrus; a negative correlation was found in the (g) left middle frontal gyrus and (h) right superior frontal gyrus. Correlation between TMT and mReHo scores in the HTN group. The t-score of t-statistics and scatter plot indicate a negative correlation in the (i) left middle frontal gyrus and (j) left superior frontal gyrus, with p < 0.02 and cluster size > 50. Correlation between CGUOFT and mfALFF in the HTN group. The t-score of t-statistics and scatter plot indicate a positive correlation in the (k) right superior temporal gyrus and (l) left inferior temporal gyrus. Correlation between CGUOFT and mReHo in the HTN group. The t-score of t-statistics and scatter plot indicate a positive correlation in the (m) left insula, (n) left middle frontal gyrus, and (o) right inferior temporal gyrus, with p < 0.02 and cluster size > 50. The color bar indicates the t-score.

