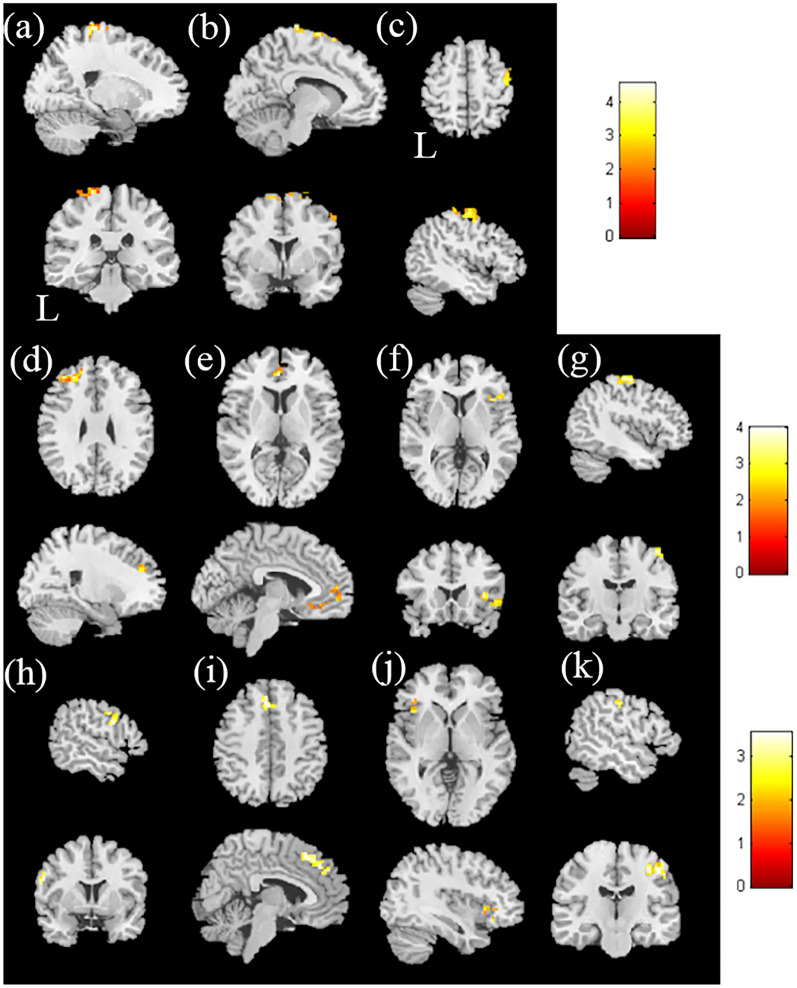
Figure 4.
The correlation between DSS and mfALFF in the HTN group. The t-score of t-statistics and scatter plot indicate a positive correlation in the (a) left superior frontal gyrus, (b) right superior frontal gyrus, and (c) right middle frontal gyrus. The correlation between DSS and mReHo in the HTN group. The t-score of t-statistics and scatter plot indicate a positive correlation in the (d) left superior frontal gyrus, (e) right medial frontal gyrus, (f) right insula, and (g) right precentral gyrus, with p < 0.02 and cluster size > 60. The correlation between the duration of hypertension and mfALFF in the HTN group. The t-score of t-statistics and scatter plot indicate a positive correlation in the (h) left inferior frontal gyrus and (i) right medial frontal gyrus. Correlation between the duration of hypertension and mReHo in the HTN group. The t-score of t-statistics and scatter plot indicate a positive correlation in the (j) left inferior frontal gyrus and (k) right postcentral gyrus, with p < 0.02 and cluster size > 50. The color bar indicates the t-score.

