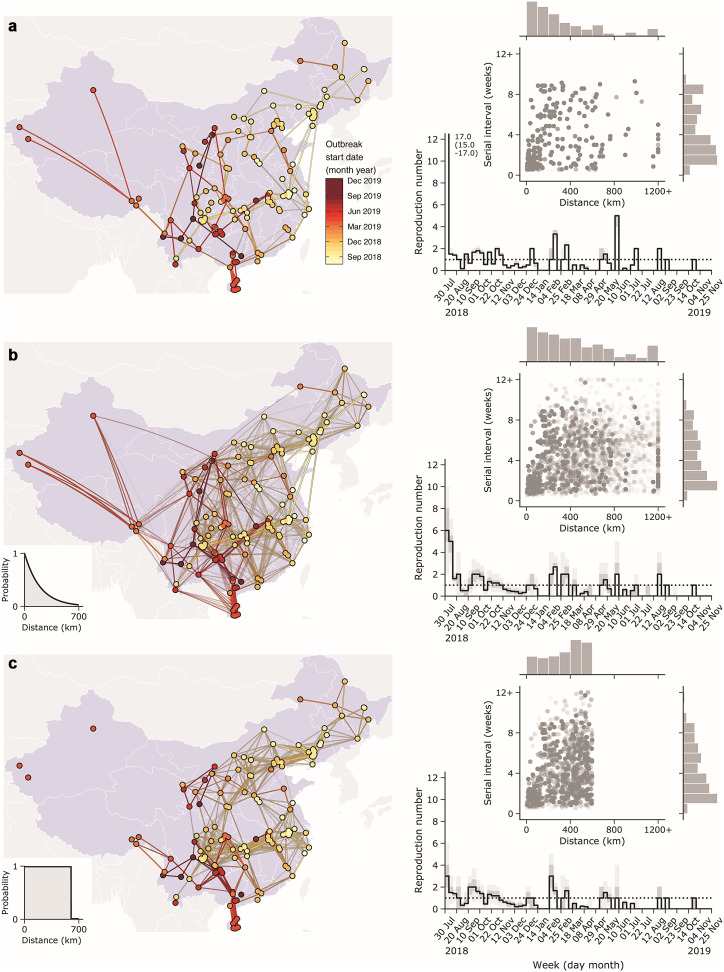
Figure 2.
Reconstructed transmission networks of African swine fever (ASF) outbreak from July 2018–September 2019 in China and estimates of reproduction number and serial interval from reconstructed networks. Three transmission networks are reconstructed by using (a) nearest neighbour, (b) exponential function, and (c) equal probability algorithms, analysing only outbreaks reported to the World Organization for Animal Health (WOAH). The dot and line colours in the map represent the start date of the outbreak in each infected unit. Correlations between the serial interval and transmission distance are shown in the upper right side of each figure. The points indicate each ASF-infected farm and bars represent the distribution of estimated distance and serial intervals, using the reconstructed transmission networks, respectively. The lines and shades in each of the figures on the right show the estimated reproduction number and its 95% credible intervals by calendar week. The epidemic threshold
 ) is represented with a dashed line.

