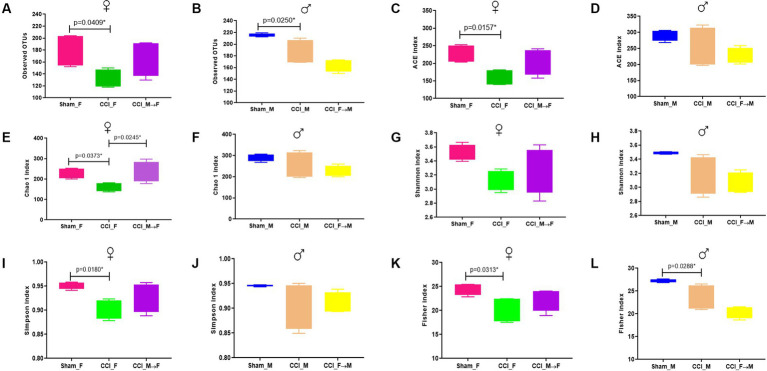
Figure 2.
Graphs showing the richness and diversity index. Observed OTUs were (A) p = 0.0409 vs. CCI_F and (B) p = 0.0250 vs. CCI_M mice. ACE index showing p = 0.0157 vs. CCI_F mice (C,D). No significant difference compared with CCI_M mice. Chao 1 index (E) p = 0.0373 vs. CCI_F, and no significant difference was seen in CCI_M mice (F). Shannon index (G,H) represents a greater decline in CCI mice of both sexes compared with Sham and FMT groups. Simpson index showing p = 0.0180 vs. CCI_F (I), and no significant difference is seen in CCI_M (J). Fisher index (K,L) represents p = 0.0313 vs. CCI_F and p = 0.0288 vs. CCI_M mice, respectively.

