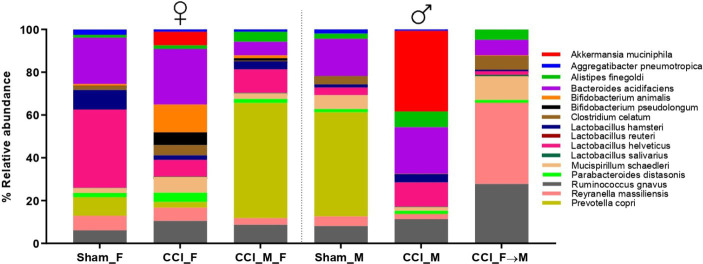
Figure 7.
Stacked bar plot showing the abundance of top 16 species level across the sham mice of female and male (Sham_F and Sham_M), CCI-induced female (CCI_F) and male (CCI_M) mice, and fecal microbial recipient groups, i.e., CCI_M → F (male mice as donor to female mice as recipient) and CCI_F → M (Female mice as a donor to male mice as recipient) using GraphPad Prism software.

