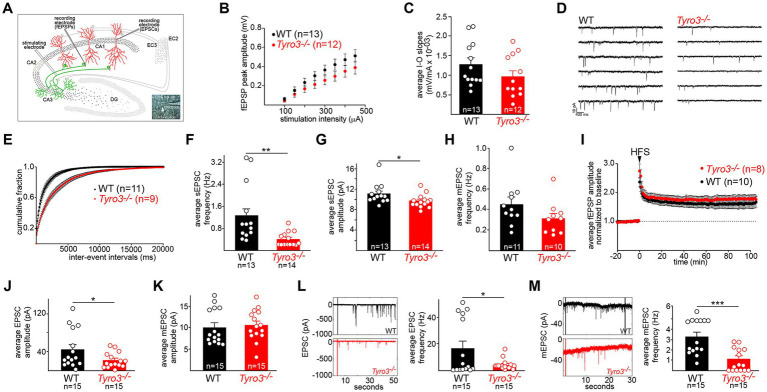
Figure 2.
Immature synaptic physiology of Tyro3−/− neurons. (A) Standard in vitro recording set-up for mouse hippocampal slices, illustrating the positions of stimulating and recording electrodes within the slice (see Methods). EC, entorhinal cortex. Inset: electrode in a CA1 neuronal cell body. (B) Quantification of averaged field excitatory post-synaptic potential (fEPSP) amplitudes (in millivolts, mV) versus stimulus intensity (microamperes, μA) in the indicated number of WT versus Tyro3−/− hippocampal slices (one slice per mouse). (C) Mean of input–output (I–O) slopes for WT versus Tyro3−/− slices. n is number of slices for each genotype; one slice per mouse. (D) Representative traces of spontaneous EPS currents (sEPSCs) in WT and Tyro3−/− slice. (E) Cumulative distribution of mean sEPSC inter-event intervals in WT (11 mice) versus Tyro3−/− (9 mice). (F) Quantification of the average frequency of sEPSCs (Hertz, Hz) in the indicated number of WT versus Tyro3−/− cells. (G) Quantification of the average amplitude of sEPSCs (pA) in the indicated number of WT versus Tyro3−/− cells. For panels (F,G), p-values are * <0.05, ** < 0.01, Mann–Whitney test. (H) Quantification of the average frequency of mini EPSCs (mEPSCs), recorded in the presence of TTX, in the indicated number of WT versus Tyro3−/− cells. n is number of cells recorded from 7 WT and 5 Tyro3−/− mice. (I) Induction of hippocampal LTP by high frequency stimulation (HFS; see Methods) in WT versus Tyro3−/− hippocampal slices. n is number of slices for each genotype; one slice per mouse. Average fEPSPs are normalized to 10 min baseline. (J) Quantification of average EPSC amplitude in picoamperes (pA) in cultured hippocampal neurons prepared from WT versus Tyro3−/− mice. (K) Quantification of average mEPSC amplitude (pA) in cultured hippocampal neurons prepared from WT versus Tyro3−/− mice. (L) (Left) representative traces of EPSCs recorded over 50 s in cultured hippocampal neurons prepared from WT versus Tyro3−/− mice. (Right) Average EPSC frequency (Hz) in cultured hippocampal neurons prepared from WT and Tyro3−/− mice. (M) (Left) representative traces of mEPSCs recorded over 30 s in cultured hippocampal neurons prepared from WT versus Tyro3−/− mice. (Right) Average mEPSC frequency in cultured hippocampal neurons prepared from WT versus Tyro3−/− mice. For panels (J–M), n is number of cultured WT and Tyro3−/− neurons analyzed. p-values: * <0.05; ** <0.01, *** <0.001, Mann–Whitney test.

