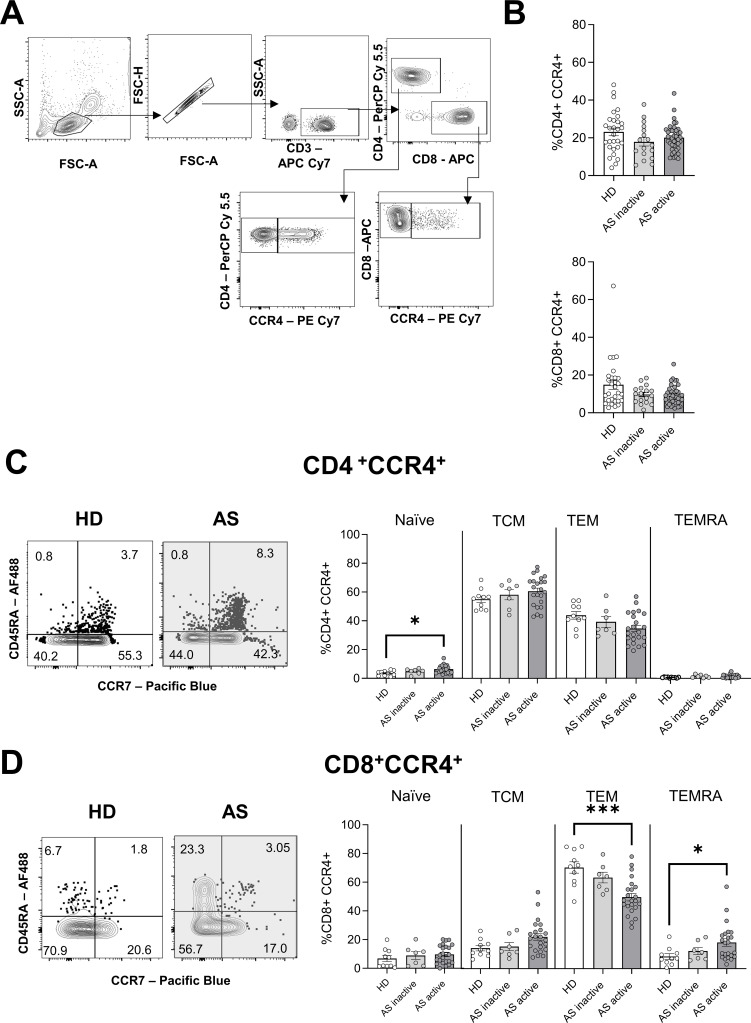
Figure 1.
Phenotype of CCR4+ T cells from patients with AS and HD. (A) Gating strategy for the analysis of CCR4+ T cells. (B) Mean frequency±SEM of CD4+ (top) and CD8+ (bottom) T cells expressing CCR4 in HD and patients with active or inactive AS, according to Ankylosing Spondylitis Disease Activity Score. (C and D) Representative plot from the flow cytometric analysis showing the expression of CD45RA and CCR7 by CD4+CCR4+ (C) and CD8+CCR4+ (D) T cells. The numbers indicate the proportion of the population in each quadrant. Mean frequency±SEM of naive (CD45RA+CCR7+), TCM (CD45RA-CCR7+), TEM (CD45RA-CCR7-) and TEMRA (CD45RA+CCR7-) are represented for HD and patients with AS. Each symbol represents an individual. Kruskal-Wallis was used for the analysis, and asterisks indicate significant differences between the groups (*p<0.05, ***p<0.001). AS, ankylosing spondylitis; HD, healthy donor; TCM, T cell central memory; TEM, T cell effector memory; TEMRA, T cell effector memory re-expressing CD45RA.

