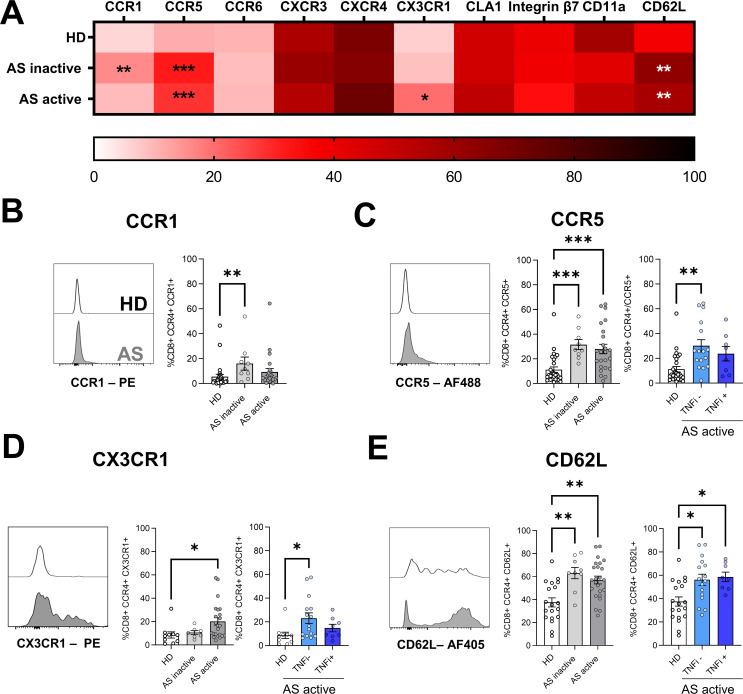
Figure 2.
Expression of chemokine receptors and adhesion molecules in CD8+CCR4+ T cells. (A) Heatmap summarising mean frequencies of expression of the reported chemokine receptor and adhesion molecules in CD8+CCR4+ T cells. (B-E) Expression of significantly different receptors is represented as overlaid histograms (left) and mean frequencies±SEM (right) of CD8+CCR4+ T cells. Each symbol represents an individual, and Kruskal-Wallis test was used to compare the markers among the groups; asterisks indicate significant differences between the groups (*p<0.05, **p<0.01 ***p<0.001).

