Figure 3.
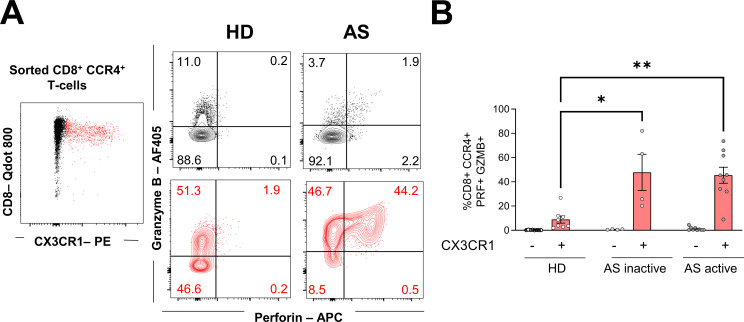
PRF and GZMB secretion by CD8+CCR4+ T cells. Sorted CD8+CCR4+ T cells were stimulated with phorbol 12-myristate 13-acetate and ionomycin for 5 hours and expression of CX3CR1, PRF and GZMB was assessed. (A) Representative plot showing CX3CR1- (black) and CX3CR1+ (red) cells expressing PRF and GZMB. Numbers in each quadrant report percentages relative to the parental population. (B) Mean frequencies±SEM of PRF+GZMB+ cells relative to CD8+CCR4+ CX3CR1- (black) or CX3CR1+ (red) cells. Each symbol represents an individual, and Kruskal-Wallis was used to compare PRF and GZMB production between groups within the CX3CR1+ or the CX3CR1- populations. Asterisks indicate significant differences between the groups (*p<0.05, **p<0.01). GZMB, granzyme B; PRF, perforin.

