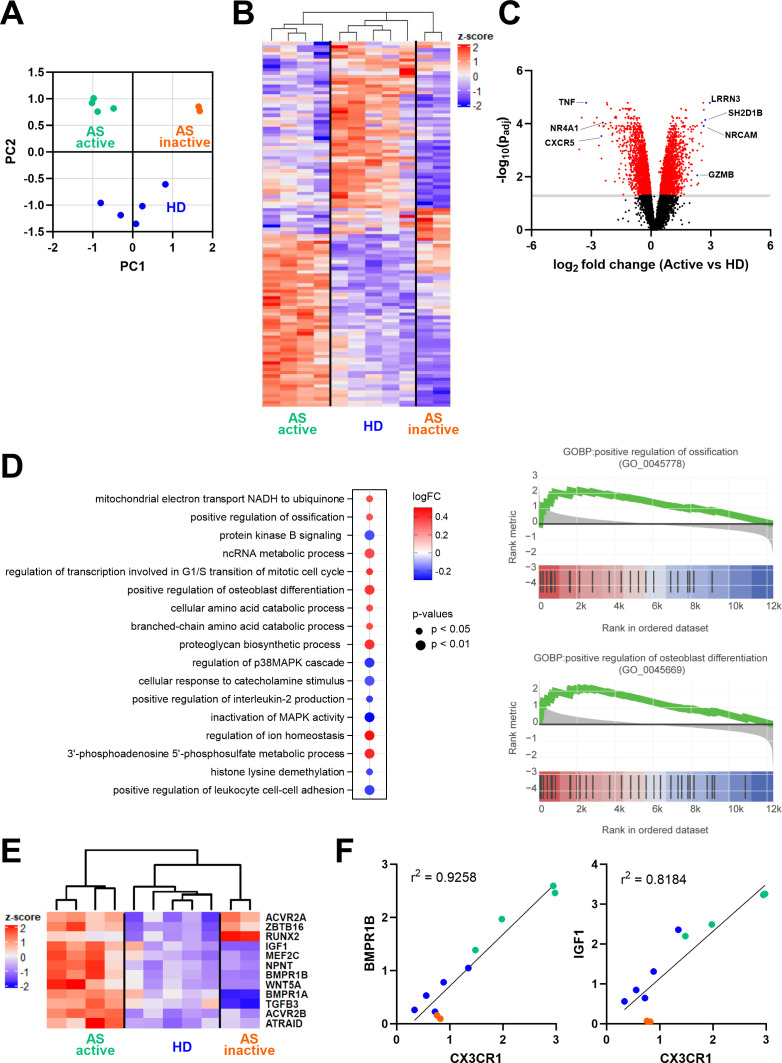
Figure 4.
Gene expression analysis of sorted CD8+CCR4+ T cells. (A) Principal component analysis and sample clustering based on the whole transcriptome. (B) Heatmap showing normalised expression of the significantly differentially expressed genes between active AS and HD. (C) Volcano plot displaying differentially expressed genes between active AS and HD; in red are highlighted the significantly different genes (−log10(p value adjusted) > 1). (D) The graph on the left shows the top 10 upregulated and the seven downregulated pathways identified in the gene set enrichment analysis between active AS and HD. Pathways were ordered based on the number of identified genes in the dataset. The graphs on the right show gene set enrichment analysis of the Gene Ontology Biological Process (GOBP) related to positive regulation of ossification and osteoblast differentiation in patients with active AS. The y-axis reports the fold change expression compared with control samples, while in the x-axis, black bars indicate the rank of genes in the gene set list. The green curve corresponds to the running statistics of the enrichment score. (E) The heatmap reports significantly upregulated genes promoting ossification in active AS. (F) Correlation of CX3CR1 and BMPR1B or IGF1 gene expression detected in the RNA sequencing analysis. AS, ankylosing spondylitis; HD, healthy donor.

