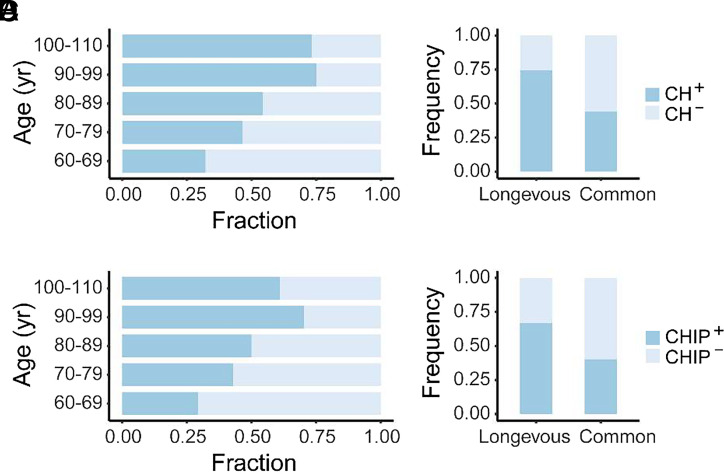
Fig. 1.
CH in longevous elderly group and common elderly group. (A) Proportion of CH in different age intervals. (B) Proportion of CHIP in different age intervals. (C) Stacked bar plot depicting individuals with CH (CH+) and individuals without CH (CH−) in the longevous versus common elderly groups. Chi-square test indicates a significant difference between the two age groups (P < 0.001). (D) Stacked bar plot illustrating individuals with (CHIP+) and individuals without CHIP (CHIP−) in the longevous versus common elderly groups. Chi-square test indicates a significant difference between the two age groups (P < 0.001).

