Fig. 4.
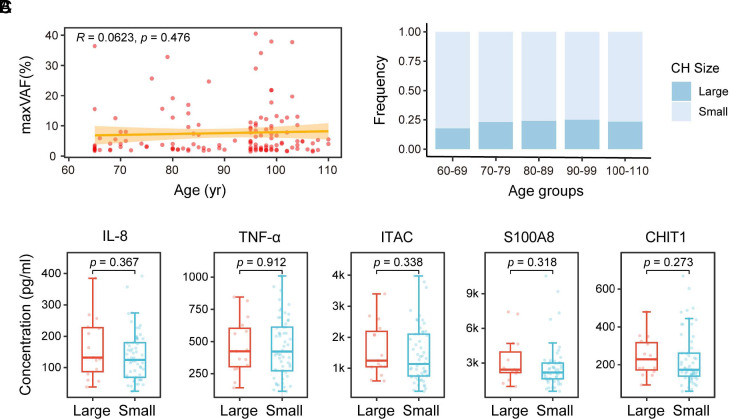
Correlation between the size of CH versus age and aging biomarkers. (A) Scatter plot illustrating the size of CH (reflected by maxVAF) in each CH-positive individual across age. The relationship between the size of CH and age was assessed by Spearman’s correlation. Calculated correlation coefficient and P-value are labeled. The orange-yellow band represents the 95% CI for the linear regression. (B) Stacked bar plot depicting CH with VAF ≥ 10% (Large) and CH with VAF < 10% (Small) in 5 age groups. Statistical analysis using the chi-square test indicates no significant difference between the groups (P = 0.983). (C) Comparison of the expression of aging biomarkers between individuals harboring CH with VAF ≥ 10% (Large) and individuals harboring CH with VAF < 10% (Small). Wilcoxon’s rank-sum test was used for statistical analysis, with the resulting P-value labeled for each comparison.

