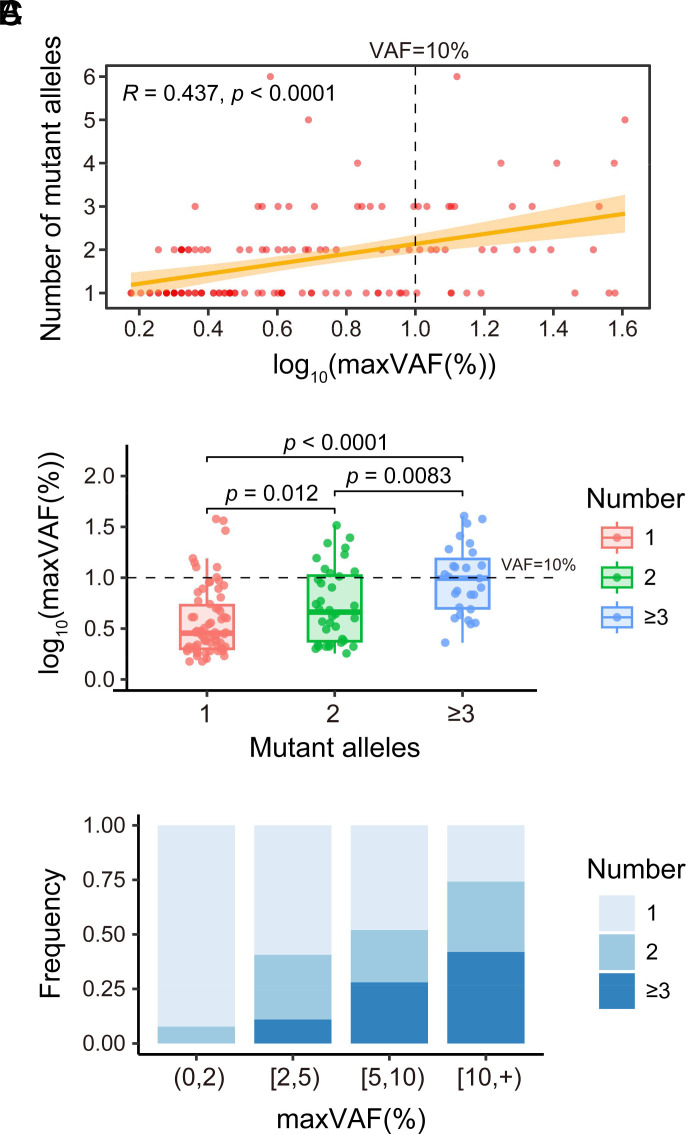
Fig. 5.
Correlation between the size of CH versus the number of mutant alleles per individual. (A) Scatter plot illustrating the number of mutant alleles per individual and the size of CH [expressed as log10(maxVAF(%))]. The relationship between the number of mutant alleles per individual and the size of CH was assessed by Spearman's correlation. Calculated correlation coefficient and P-value are labeled. The orange-yellow band represents the 95% CI for the linear regression. (B) Comparison of the number of mutant alleles per individual, as indicated, and the size of CH [expressed as log10(maxVAF(%))]. (C) Stacked bar plot depicting CH-positive individuals with different numbers of mutant alleles, as indicated, in 4 different CH size (represented as maxVAF) groups. (0,2), [2,5), [5,10), and [10, +) represent the VAF of CH size groups <2%, ≥2% to <5%, ≥5% to <10%, and ≥10%, respectively.

