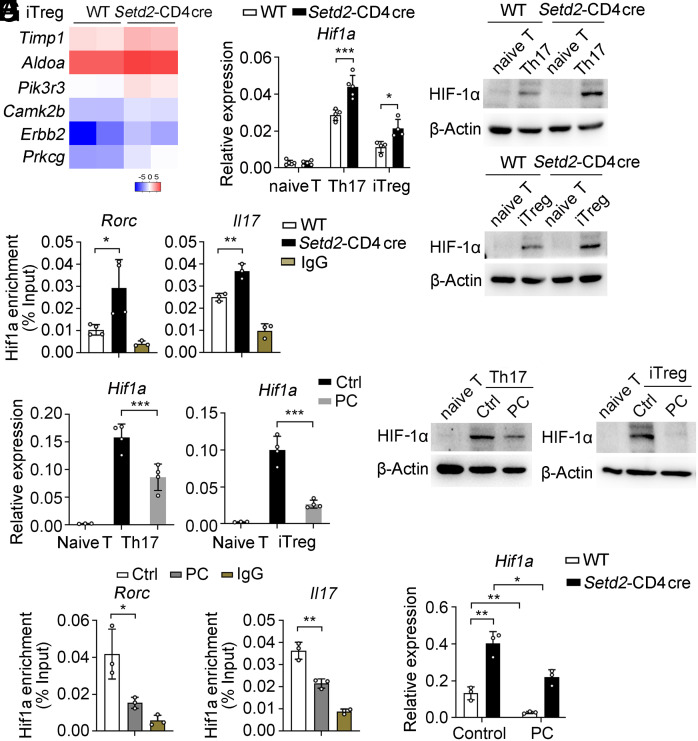
Fig. 6.
Setd2 increases PC(16:0, 18:2) levels to inhibit HIF-1α transcriptional activity. (A) Heatmap showing HIF-1 signaling-linked genes in iTreg cells (fold change ≥ 2, P < 0.05). (B and C) mRNA and protein levels of HIF-1α in T cells (n = 4 to 5). (D) ChIP-qPCR analysis of HIF-1α enrichment at the Rorc and Il17 promoter region in Th17 cells (n = 3 to 4). (E and F) mRNA and protein levels of HIF-1α in Th17 and iTreg cells after stimulation with control or PC(16:0, 18:2) (n = 3 to 4). (G) ChIP-qPCR analysis of the enrichment of Hif1α at the Rorc and Il17 promoter regions in Th17 cells after stimulation with control or PC (n = 3). (H) qPCR analysis of Hif1a mRNA in Th17 cells after stimulation with control or PC (n = 3). Data show one of three independent experiments. Results are presented as means ± SD (B, D, E, G, and H). *P < 0.05, **P < 0.01, and ***P < 0.001.

