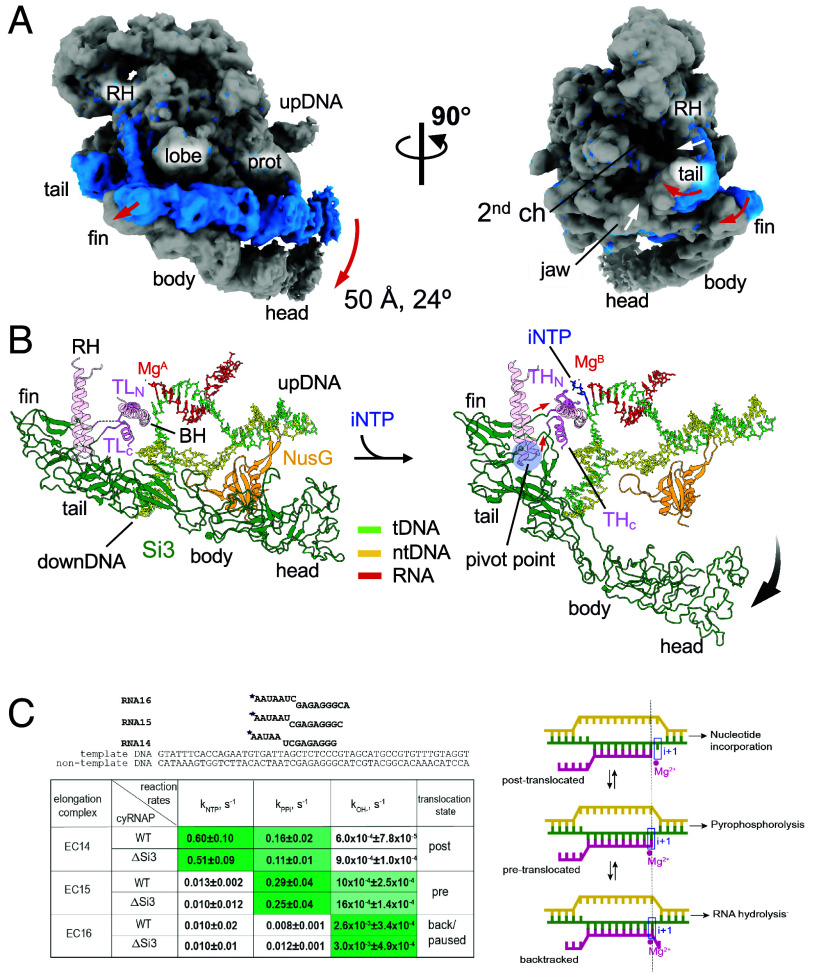
Fig. 4.
Si3 movement during the trigger helix folding. (A) Cryo-EM maps of the iNTP-bound (gray) and iNTP-free (light blue) states of the EC-NusG strains (RH, rim helix; prot, protrusion; upDNA, upstream DNA). Red and white arrows indicate movement of Si3 and main body of cyRNAP (rim helix and jaw domain), respectively, by trigger helix folding. (B) Conformational change in Si3 during the transition from the trigger loop (TL) to the trigger helix (TH) by iNTP (blue stick model) binding. The red and black arrows indicate movements of the TL/TH-Si3 linker and Si3, respectively. A pivot point for converting the movement of the linker to the swing motion of Si3 is shown as a blue transparent circle. (C) Si3 does not influence catalysis by cyRNAP. Scheme and sequence of the assembled elongation complex used for experiments with WT and ΔSi3 RNAPs. The table represents the summary of reaction rate constants of single nucleotide addition (kNTP), pyrophosphorolysis (kPPi), and transcript hydrolysis (kOH−) in EC14, EC15, and EC16 by WT and ΔSi3 RNAPs. Data are presented as mean values ±SD from ≥3 biological replicates. The corresponding representative gels are shown in SI Appendix, Fig. S7. The shade of green in the cells reflects the value of the constant, i.e., darkest shade corresponds to the highest rate. The right column shows the predominant translocation states of the elongation complexes, as deduced from the relative rates of reaction. Scheme of RNAP oscillation in translocation equilibrium and the architecture of the nucleic acid scaffold of the elongation complex in post‐translocation, pre‐translocation, and backtracked states, as adapted from ref. 22. The template DNA, the non-template DNA and the RNA are green, yellow, and pink, respectively. Catalytic Mg2+ ions and the i+1 site of the RNAP active center are shown by a red circle and a blue rectangle, respectively.

