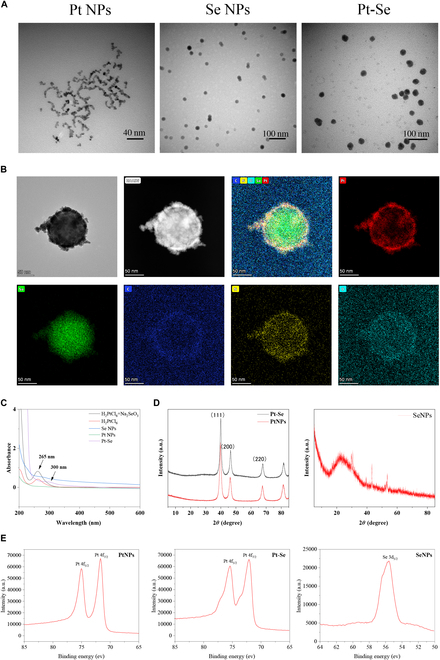
Fig. 2.

Characterization of Pt–Se NPs. (A) Representative TEM image of NPs (Pt, Se, Pt–Se). (B) TEM mapping of Pt–Se NPs: TEM and HAADF of Pt–Se; distribution diagram of Pt, Se, C, N, and O elements. (C) UV-vis spectra of Pt and Pt–Se NPs. (D) XRD results of Se NPs, Pt NPs, and Pt–Se NPs. (E) The XPS spectra were collected in both Pt and Pt–Se NPs, and Se 3d region in Pt–Se NPs.
