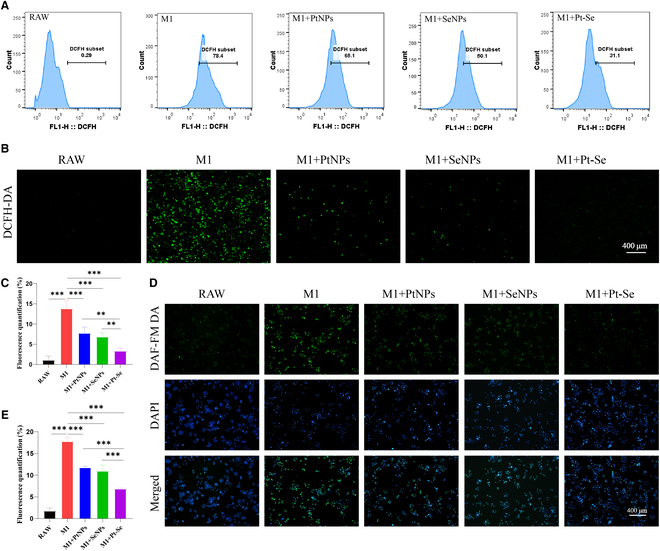
Fig. 5.

Effects of NPs on intracellular ROS and NO. (A) Flow cytometry analysis and fluorescence images (B) of intracellular ROS levels in RAW264.7 cells by a DCFH-DA probe after treatment with NPs. (C) Relative quantitation of ROS-scavenging ability by fluorescent images. (D) The DAF-FM DA probe was utilized to detect the levels of NO in macrophages, and the relative quantitative of NO was measured (E). Original magnification, 100×. Scale bar, 400 μm. n = 3. **P < 0.01, ***P < 0.001.
