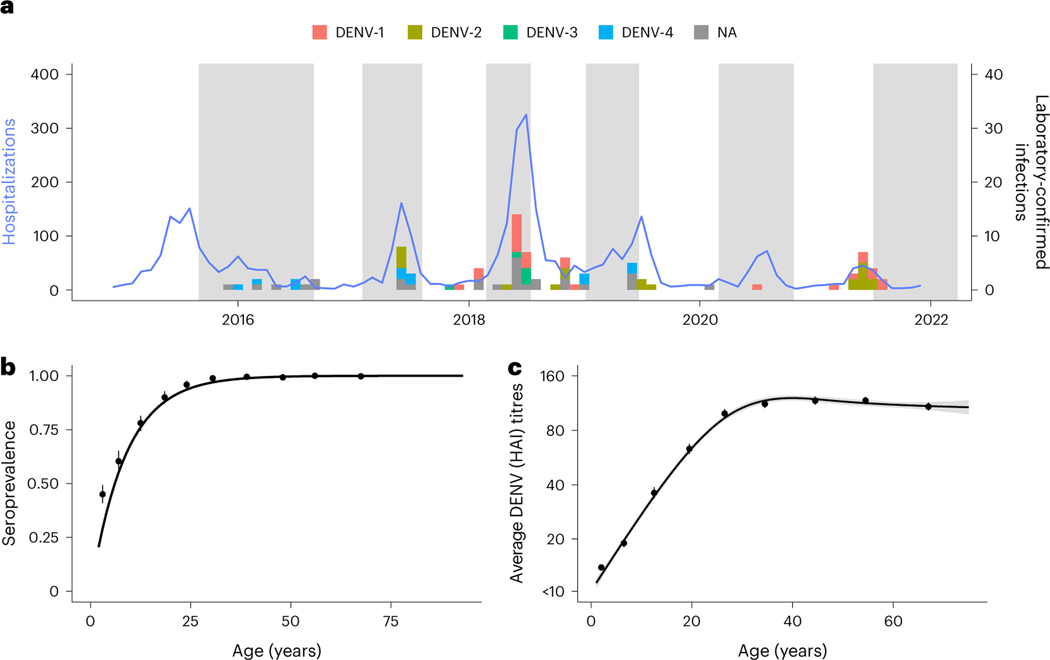
Fig. 1 |. Cohort data summary (n = 11,131).
a, Hospitalization counts for Kamphaeng Phet from 2015 to 2021 (blue solid line). The bars represent the timing of the confirmed DENV infections used to train the model (n = 90). Serotype information was ascertained via RT-PCR with those confirmed using only serology labeled as NA. The shaded time periods represent active sampling periods during the cohort study when yearly blood draws were taken. b, Age-stratified seropositive individuals at enrollment for participants enrolled before 2017. The points are mean seroprevalence found at each tenth percentile age bin, and the line is the resulting fit using the serocatalytic model for non-newborns below 30 years old (n = 6,197; details found in Supplementary Information). c, Average DENV HAI titres at enrollment age binned into each tenth percentile. Confidence bounds (95%) for b and c are found using a basic non-parametric bootstrap, while a generalized linear model is fit in black. Mean and 95% confidence interval are presented as the line and shaded region.

