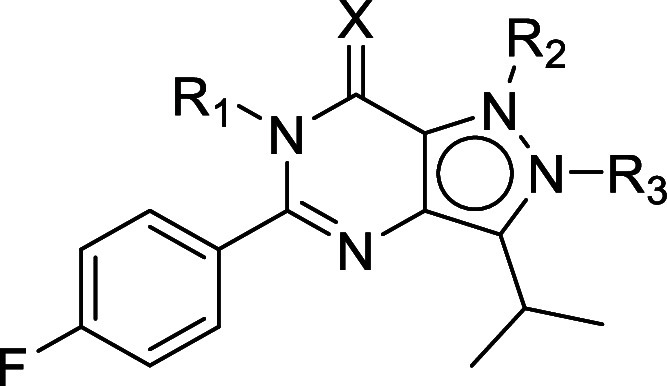
Table 1. In Vitro Antitrypanosomal Potency and Cytotoxicity of Analogues 7, 11, 15, and 17.

| compound | R1 | R2 | R3 | X | MW | cLogPa | tPSAa | pIC50b |
|
|---|---|---|---|---|---|---|---|---|---|
| T. brucei | MRC-5 | ||||||||
| 2 | H | H | O | 272.3 | 3.1 | 70.1 | 7.2 ± 0.2 | <4.2 | |
| 7 | Me | H | O | 286.3 | 2.6 | 61.4 | <5.0 | <4.2 | |
| 11 | H | Me | O | 286.3 | 3.0 | 59.3 | 7.1 ± 0.1 | <4.2 | |
| 15 | H | Me | O | 286.3 | 3.2 | 59.3 | 5.8 ± 0.1 | <4.2 | |
| 17 | H | H | NH | 271.3 | 3.5 | 80.5 | <5.0 | 4.6 ± 0.0 | |
cLogP and tPSA are adopted from the Collaborative Drug Discovery (CDD) Vault.
Mean values ± standard deviations, n ≥ 2.
