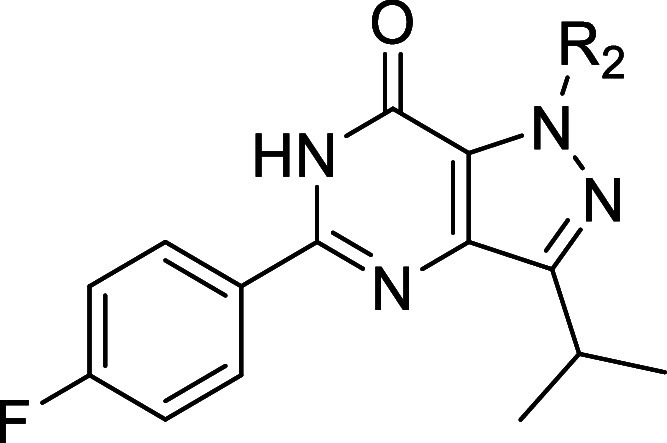
Table 2. In Vitro Antitrypanosomal Activity and Cytotoxicity of R2 Analogues.

| compound | R2 | MW | cLogPa | tPSAa | pIC50b |
|
|---|---|---|---|---|---|---|
| T. brucei | MRC-5 | |||||
| 2 | H | 272.3 | 3.1 | 70.1 | 7.2 ± 0.2 | <4.2 |
| 11 | Me | 286.3 | 3.0 | 59.3 | 7.1 ± 0.1 | <4.2 |
| 21a | Et | 300.3 | 3.4 | 59.3 | 6.6 ± 0.4 | <4.2 |
| 21b | nPr | 314.4 | 3.9 | 59.3 | 6.8 ± 0.2 | <4.2 |
| 21c | iPr | 314.4 | 3.8 | 59.3 | 5.2 ± 0.1 | <4.2 |
| 21d | -(CH2)2OMe | 330.4 | 3.0 | 68.5 | <4.2 | <4.2 |
| 22 | -(CH2)2OH | 316.3 | 2.3 | 79.5 | 6.2 ± 0.1 | <4.2 |
| 21e | -(CH2)2CONH2 | 343.4 | 1.9 | 102.4 | 5.5 ± 0.3 | <4.2 |
| 21f | -(CH2)2Ph-4-OMe | 404.5 | 4.9 | 68.5 | <4.2 | <4.2 |
cLogP and tPSA are adopted from CDD Vault.
Mean values ± standard deviations, n ≥ 2.
