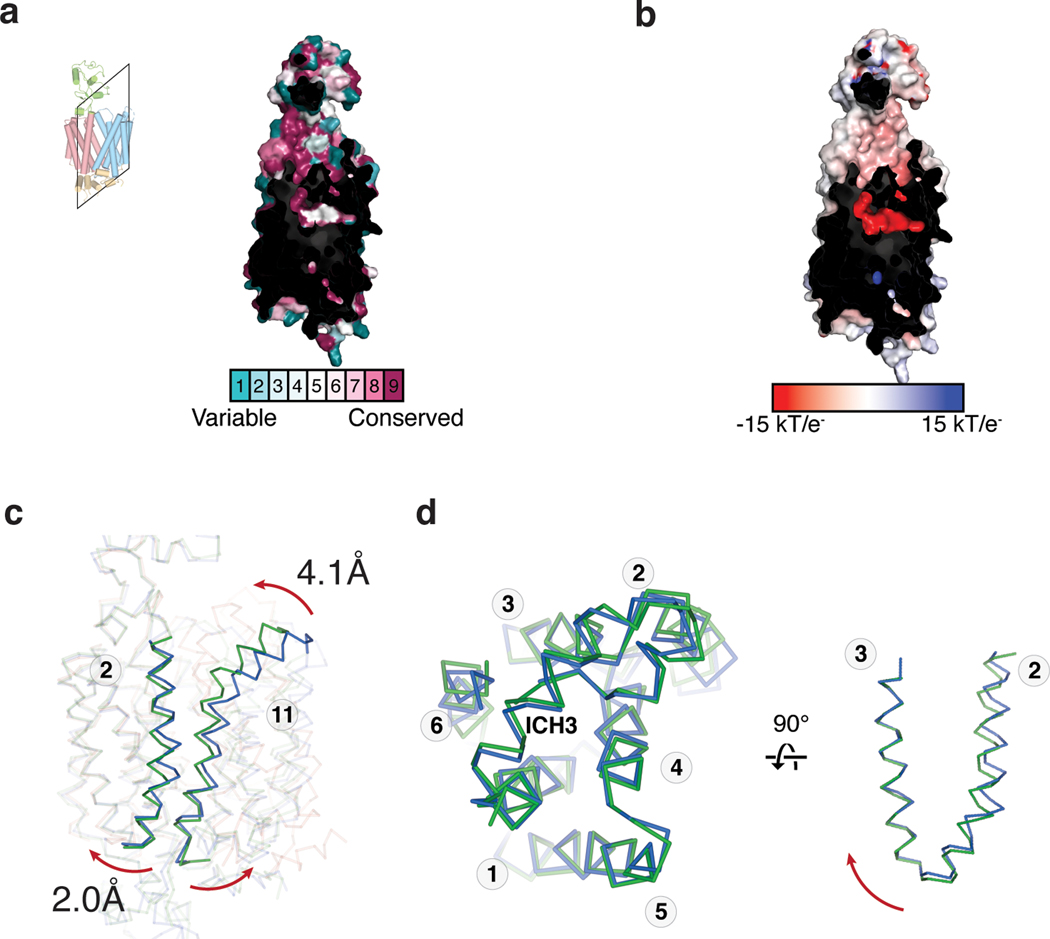
Extended Data Fig. 8. Local conformational changes associated with OCT gating.
a, ConSurf plot for OCT2cs and OCT2 homologs. b, Electrostatics surface of outward occluded OCT2, calculated by APBS. c, Concerted local conformational changes in TM2 and 11 leads to extracellular gate formation. d, Local conformational changes in the N-lobe from outward open (blue) to outward occluded (green) conformations.

