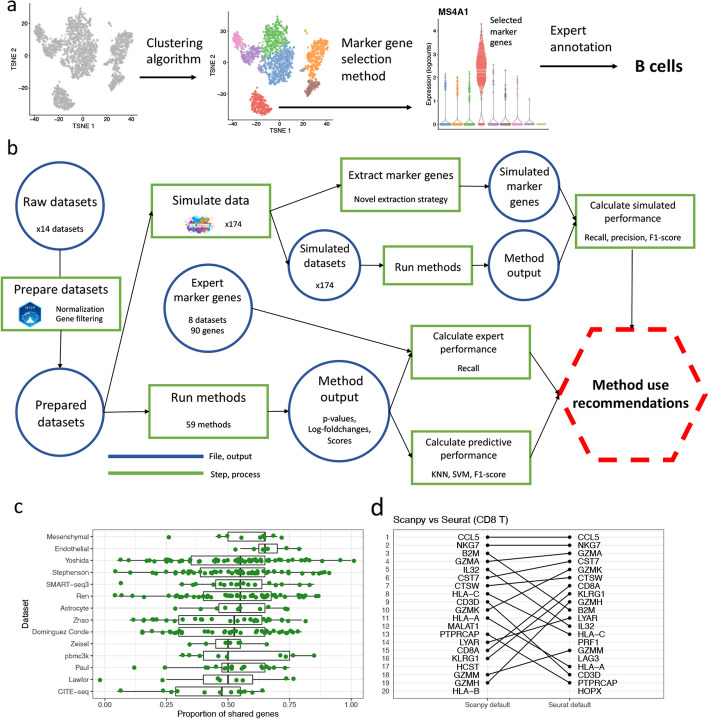
Fig. 1.
Overview of marker genes usage and benchmarking. a A visual overview of the use of marker genes to annotate clusters. First, a clustering algorithm is performed to separate cells into putative clusters. Then, for each cluster, a marker gene selection method is used extract a small number of marker genes. This gene list is inspected and the expression of the genes visualized to give an expert-annotation of cell type for each cluster. b A visual overview of the benchmarking performed in this paper. First, the real datasets are processed and the marker gene selection methods are run on the processed datasets. The output of the methods is extracted and used to calculate the methods’ predictive performance and ability to recover expert-annotated marker genes. The processed datasets are also used to simulate additional datasets, on which the methods are run and their ability to recover true simulated marker genes calculated. c The proportion of shared genes in the top 20 genes selected by the default methods implemented by Scanpy and Seurat for each cluster across 10 real datasets (127 clusters in total). d A visual comparison of the rankings of the top 20 selected genes by the default Scanpy and Seurat methods in the CD8 T cell cluster in the pbmc3k dataset

