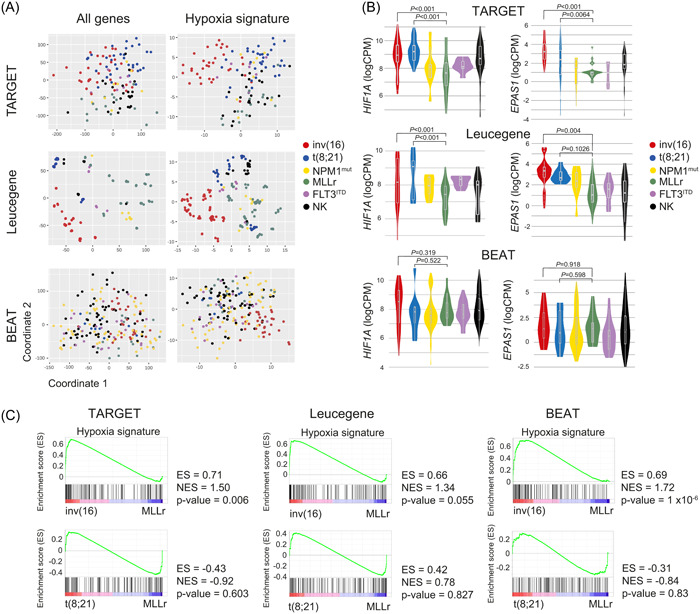
Figure 1.

Hypoxia inducible factor (HIF) pathway gene expression signature in different acute myeloid leukemia (AML) cytogenetic subgroups. (A) Multidimensional scaling (MDS) representation of AML samples from TARGET (78 patient samples and 147 runs), Leucegene (72 patient samples and 301 runs), and BEAT‐AML (206 patients and 707 runs) datasets analyzing the expression of all the detected genes (left panels) or, specifically, the 119 HIF target genes (right panels). (B) Expression (LogCPM) of HIF1A and HIF2A (EPAS1) in each cytogenetic AML subgroup from TARGET, Leucegene, and BEAT‐AML. (C) Gene set enrichment analysis (GSEA) of the HIF pathway comparing inv(16) and t(8;21) with MLLr AMLs. CPM, counts per million; ES, enrichment score; NES, normalized enrichment score.
