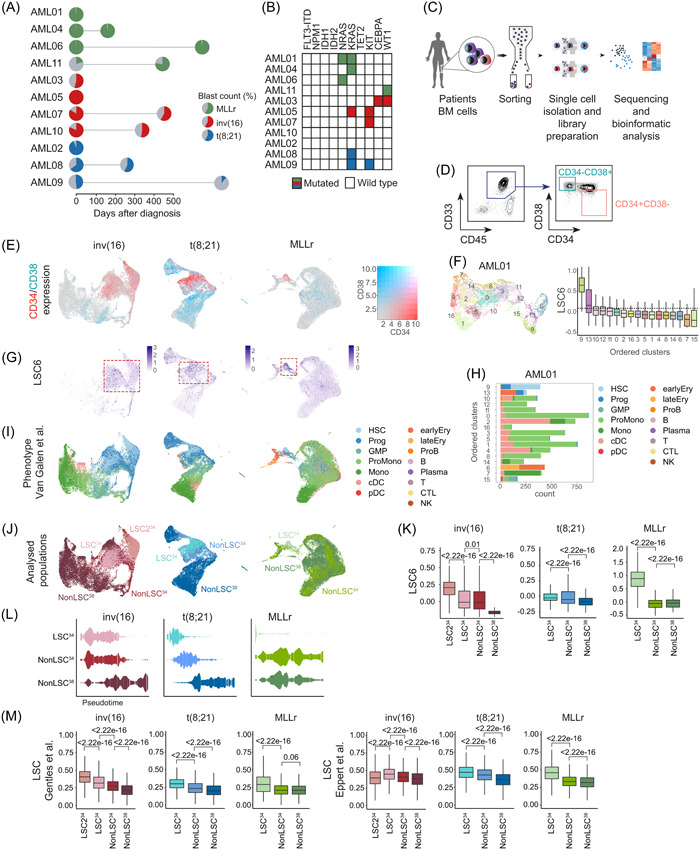
Figure 2.

Enrichment and identification of the leukemia stem cell (LSC) compartment in the scRNA‐seq dataset. (A) Overview of the primary acute myeloid leukemia (AML) samples used for the scRNA‐seq analysis. The distinct cytogenetic subgroups are color‐coded. The colored area of the pie charts depicts the percentage of blasts. Paired‐relapsed samples are depicted with a second pie chart at the time of relapse. Further information on each sample can be found in Table S3. (B) Mutational profile of the analyzed samples. (C) Scheme depicting the different steps from sample sourcing to scRNA‐seq analysis. (D) Representative FACS profile depicting how the CD34+CD38− and CD34−CD38+AML cells were FACS‐purified for scRNA‐seq. The specific FACS profiles of each AML sample can be found in Supporting Information S1: Figure S1. (E) Uniform manifold approximation and projection (UMAP) plots showing the expression of CD34 and CD38 among all cells integrated from different samples in each cytogenetic subgroup. (F) UMAP plot showing the random clusterization of the cells from the sample AML01 and boxplot of the LSC6 score (Elsayed et al. 35 ) of each cluster for the identification of the LSC‐enriched cluster. Dotted line marks the 9th decile. (G) UMAP plots depicting the LSC6 score assigned to each cell. All cells from the different samples in each cytogenetic subgroup are integrated. Red square marks the LSC6‐enriched area. (H) Number of cells from each predicted phenotype, according to Van Galen et al., 36 included in each cluster identified in sample AML01. (I, J) UMAP plots showing the predicted phenotype of the cells according to Van Galen et al. 36 (I), and the assigned population (LSC34, nonLSC34, and nonLSC38) (J) for downstream analysis. All cells from the different samples in each cytogenetic subgroup are integrated. (K) LSC6 (Elsayed et al. 35 ) score of each of the defined populations (LSC34, nonLSC34, and nonLSC38). Nonparametric Wilcoxon test p‐values are shown for each comparison. (L) Trajectory/pseudotime analysis of the defined populations from the different cytogenetic subgroups. (M) Expression of the LSC signatures described by Gentles. 37 and Eppert et al. 31 in each of the defined populations for the different cytogenetic subgroups. Nonparametric Wilcoxon test p‐values are shown for each comparison. B, mature B cell; cDC, conventional dendritic cells; CTL, cytotoxic T lymphocyte; Ery, erythroid progenitor; FACS, fluorescence‐activated cell sorting; GMP, granulocyte‐macrophage progenitor; HSC, hematopoietic stem cell; log2FC, log2 fold change; Mono, monocyte; NK, natural killer cell; pDC, plasmacytoid dendritic cells; Plasma, plasma cell; ProB, B cell progenitor; Prog, progenitor; ProMono, promonocyte; T, naïve T cell.
