
Figure 3.
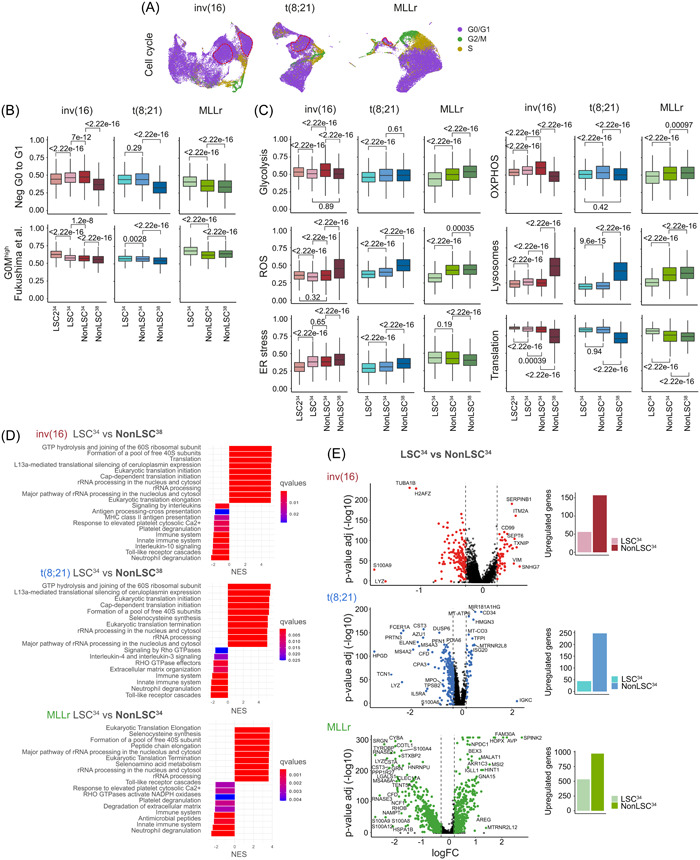
Cell cycle and metabolic characterization of the leukemia stem cells (LSC)34 cluster. (A) Uniform manifold approximation and projection (UMAP) plots showing the cell cycle phase prediction for each cell. Cells from all the different samples in each cytogenetic subgroup are integrated. (B) Quiescence status analysis of the defined populations from the different cytogenetic subgroups using the gene ontology (GO) signature Neg G0 to G1 (GO:0070 317) and the dormancy signature G0Mhigh described in Fukushima et al. 50 Nonparametric Wilcoxon test p‐values are shown for each comparison. (C) Analysis of different metabolic pathways related to stemness and hypoxia (Glycolysis, OXPHOS, reactive oxygen species [ROS], Lysosomes, ER stress, and translation) for the defined populations from the different cytogenetic subgroups. Nonparametric Wilcoxon test p‐values are shown for each comparison. (D) Gene set enrichment analysis (GSEA) showing the enriched biological pathways in the indicated populations of cells. For inv(16) and t(8;21) acute myeloid leukemia (AML), LSC34 cells are compared with nonLSC38 cells. For MLLr AML, LSC34 cells are compared with nonLSC34 cells. Complementary analyses are shown in Supporting Information S1: Figure S3. (E) Volcano plots showing the differentially expressed genes (DEGs) between LSC34 and nonLSC34 cells of each cytogenetic subgroup. Plots on the right show the total number of overexpressed genes in each population.