
Figure 4.
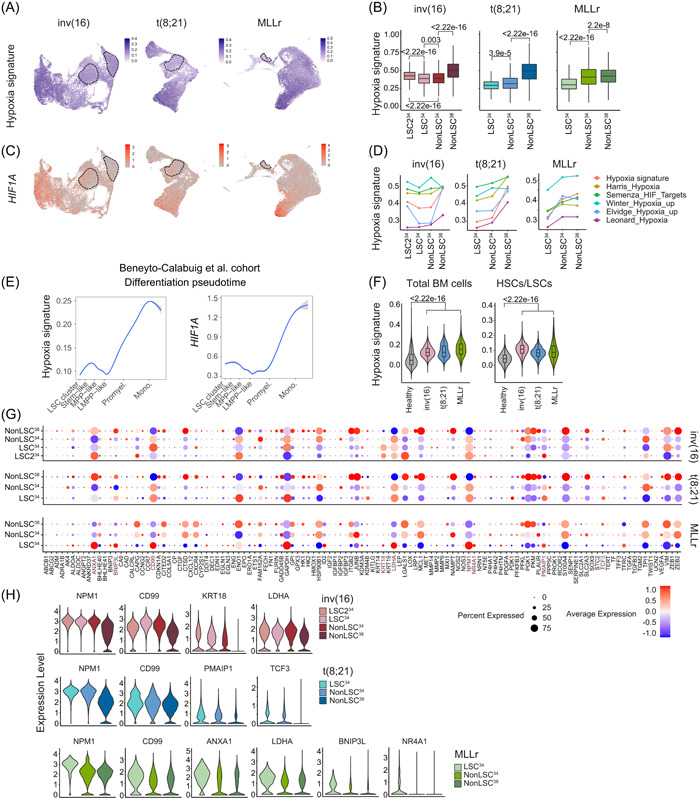
Low expression of hypoxia signaling signature in human acute myeloid leukemia (AML)‐leukemia stem cells (LSCs). (A) Uniform manifold approximation and projection (UMAP) plots showing expression of the hypoxia signature in all cells integrated from the different samples in each cytogenetic subgroup. (B) Hypoxia signature score in each of the defined populations from the different cytogenetic subgroups. Nonparametric Wilcoxon test p‐values are shown for each comparison. (C) UMAP plots showing expression of the HIF1A gene in all cells integrated from the different samples in each cytogenetic subgroup. (D) Hypoxia signature score of each of the defined clusters comparing the hypoxia signature used in this study with five hypoxia signatures previously reported. (E) Hypoxia signature and HIF1A expression in AML cells from Beneyto‐Calabuig et al. 59 AML cohort. (F) Hypoxia expression signature comparing each AML cytogenetic subgroup with healthy total BM cells (left plot) or healthy hematopoietic stem cells (HSCs)/LSCs (right plot). Nonparametric Wilcoxon test p‐values are shown for each comparison. (G) Expression of the 119 genes from the hypoxia signature in each of the defined clusters. HIF1A targets significantly highly expressed in the LSC34 cluster are highlighted in brown color. (H) Violin plots showing the expression of the significantly overexpressed genes of the hypoxia signaling pathway in the LSC34 cluster in each cytogenetic AML subgroup.