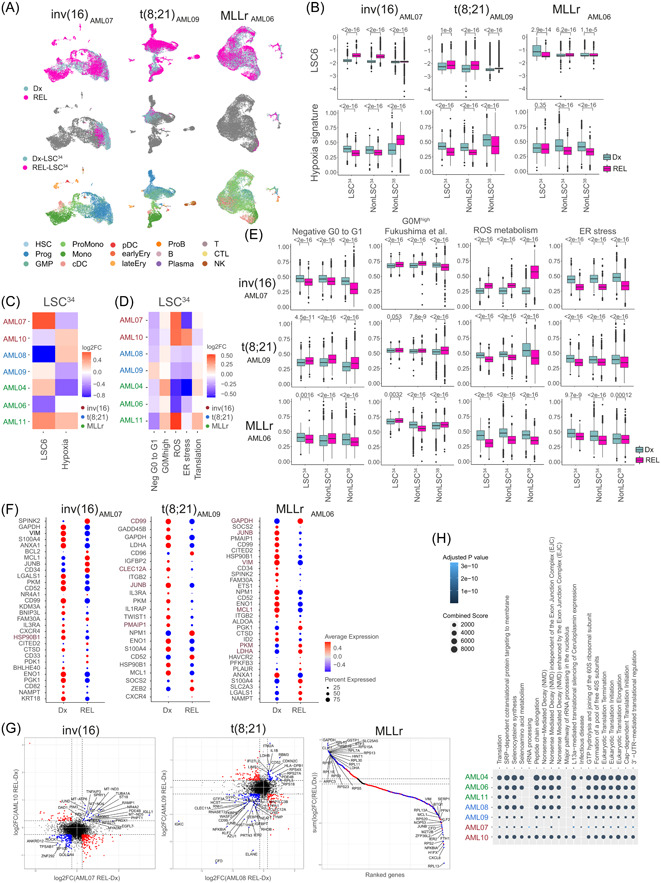
Figure 5.

Relapse (REL)‐leukemia stem cells (LSC)34 cluster reveals patient‐specific differential molecular features. (A) Uniform manifold approximation and projection (UMAP) plots integrating patient‐matched acute myeloid leukemia (AML) cells at diagnostic (Dx) and REL (top plots), showing the identified LSC34 cluster at Dx and REL (middle plots) and showing the predicted phenotype according to Van Galen et al. 36 (bottom plots). One pair from each cytogenetic subgroup is shown. Additional paired samples are analyzed in Supporting Information S1: Figure S5A,B. (B) LSC6 score (top plots) and hypoxia signature score (bottom plots) of the defined clusters at Dx and REL for each AML cytogenetic subgroup. Nonparametric Wilcoxon test p‐values are shown for each comparison. (C, D) Heatmap of the variation of the LSC6 and hypoxia (C) and metabolic pathways (D) signature scores in the LSC34 population in the seven Dx‐REL pairs. (E) Score of indicated metabolic pathways related to stemness and hypoxia in the defined clusters at Dx and REL for each AML cytogenetic subgroup. Nonparametric Wilcoxon test p‐values are shown for each comparison. (F) Hypoxia inducible factor (HIF) target genes differentially expressed in the LSC34 population at Dx versus REL in each pair from the indicated patients. Additional paired samples are analyzed in Supporting Information S1: Figure S5G. Genes consistently higher or lower expressed in all patients from each AML subgroup are highlighted in brown color. (G) Comparison of the differentially expressed genes (DEGs) in the LSC34 population of each paired sample in each cytogenetic subgroup. For inv(16) and t(8;21) AMLs, plots compare two AML Dx‐REL pairs (AML07 and AML10 for inv[16]; AML08 and AML09 for t[8;21]). For MLLr AMLs, the plot compares three AML Dx‐REL pairs (AML04, AML06, and AML11). Each dot represents a gene with similar (in blue) or different (in red) expression in paired Dx versus REL samples. (H) Reactome showing biological pathways enriched in REL‐LSC34 cells compared to Dx‐LSC34 cells. B, mature B cell; cDC, conventional dendritic cells; CTL, cytotoxic T lymphocyte; Ery, erythroid progenitor; GMP, granulocyte‐macrophage progenitor; log2FC, log2 fold change; LSC, leukemic stem cell; Mono, monocyte; NK, natural killer cell; pDC, plasmacytoid dendritic cells; Plasma, plasma cell; ProB, B cell progenitor; Prog, progenitor; ProMono, promonocyte; T, naïve T cell.
