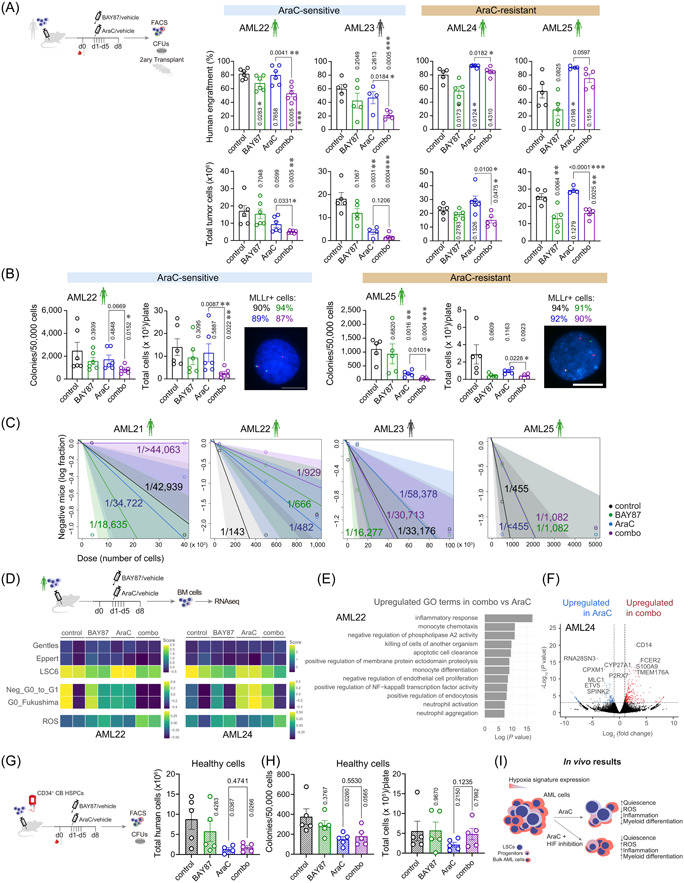
Figure 7.

Inhibition of the hypoxia inducible factor (HIF) pathway sensitizes acute myeloid leukemia (AML)‐leukemia stem cells (LSCs) to chemotherapy in vivo. (A) Human AML‐engrafted mice were treated with the indicated drugs for 5 days. After completion of the treatment, organs were collected and analyzed by FACS. Cells from the BM were used for ex vivo CFU assays and secondary transplantations. Percentage (upper plots) of human engraftment in BM after treatment and total tumor cells (bottom plots) in bones (tibias, femurs, and hips) are shown (n = 4–6 mice/group). p‐Values of the comparison to control are shown in vertical. (B) Ex vivo clonogenic capacity of BM cells retrieved from mice treated as indicated (n = 4–6/group). Left plot shows the number of colonies per 50,000 plated cells. Right plot shows the total number of cells collected from each CFU plate. FISH analysis confirmed the leukemic identity of these cells. Percentages of MLLr+ cells are shown on top of the FISH image for each indicated treatment (n = 200 counted cells). Scale bar = 10 µm. p‐Values of the comparison to control are shown in vertical. (C) BM cells from treated primary mice were transplanted into secondary recipients at specific doses. LSC estimation in secondary recipients was calculated using ELDA software. Mice were considered leukemic when presenting >0.1% human cells in BM (n = 1–5 mice/dose and group). (D) RNA sequencing analysis was performed from BM cells from treated animals (n = 2 mice/group). Heatmap showing the expression of different LSCs, quiescence, and reactive oxygen species (ROS) signatures. (E) Gene ontology (GO) terms highly expressed in combo‐treated versus AraC‐treated samples. (F) Volcano plot showing the DEGs in AraC and combo‐treated samples. (G) Human CD34+CB cells‐engrafted mice were treated with the indicated drugs for 5 days. After completion of the treatment, organs were collected and analyzed by FACS. Cells from the BM were used for ex vivo CFU assays. Total human cells in bones (tibias, femurs, and hips) after treatment are shown (n = 4–5 mice/group). p‐Values of the comparison to control are shown in vertical. (H) Ex vivo clonogenic capacity of BM cells retrieved from mice treated as indicated (n = 4–6/group). Left plot shows the number of colonies per 50,000 plated cells. Right plot shows the total number of cells collected from each CFU plate. p‐Values of the comparison to control are shown in vertical. (I) Schematic diagram depicting the impact on AML cells of HIF inhibition over the treatment with AraC. BM, bone marrow; d, day; CFU, colony unit forming; FACS, fluorescence‐activated cell sorting; PB, peripheral blood; RBC, red blood cells; WBC, white blood cells. Data are shown as mean ± SEM. *p < 0.05; **p < 0.01; ***p < 0.001. Student's t‐test analysis.
