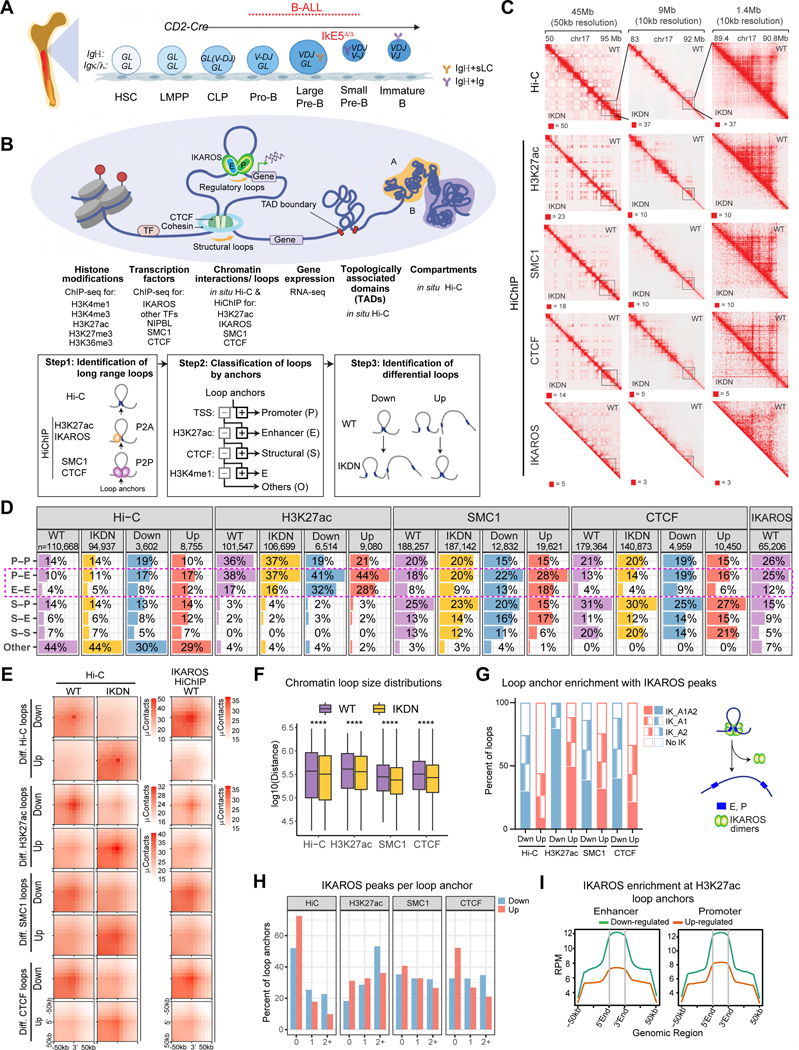
Figure 1. IKAROS controls spatial organization of large pre-B cells.
(A) Schematic of early B-cell differentiation and conditional deletion of the IKAROS DNA binding domain (IKDN). (B) Experimental strategy to profile WT and IKDN large pre-B cells. Schematic (bottom) illustrates the classification of loops, anchors and differential loops (n=2 replicates). (C) Hi-C and SMC1, H3K27ac, CTCF and IKAROS HiChIP experiments shown at 50kb and 10kb resolution around Nrxn1 in WT (upper triangle) and IKDN (lower triangle). Pixel intensity represents the observed number of contacts/valid read pairs. (D) The number and percentage of Hi-C and HiChIP interactions (WT, IKDN) and differential loops (Down, Up) identified at 10kb resolution stratified by anchor classification. (E) Aggregate peak analysis (APA) of differential chromatin loops. Top labels indicate contact maps from which the aggregate pattern is derived. (F) Distance distributions of all significant chromatin loops identified by Hi-C and HiChIP in WT or IKDN. **** p < 0.0001. (G) The percentage of differential HiChIP loops that overlap with IKAROS ChIP-seq peaks at both (IK_A1A2), only one (IK_A1, IK_A2) or none of the anchors (No IK). Model of long-distance interactions between regulatory sites supported by IKAROS-bound dimers. (H) Distribution of IKAROS peaks that overlap anchors of differential loops identified by HiChIP and Hi-C. (I) Average IKAROS ChIP-seq enrichment (RPM) at enhancer and promoter anchors (10kb) from differential H3K27ac loops as in Figure S1H. Source: TableS1-3.

