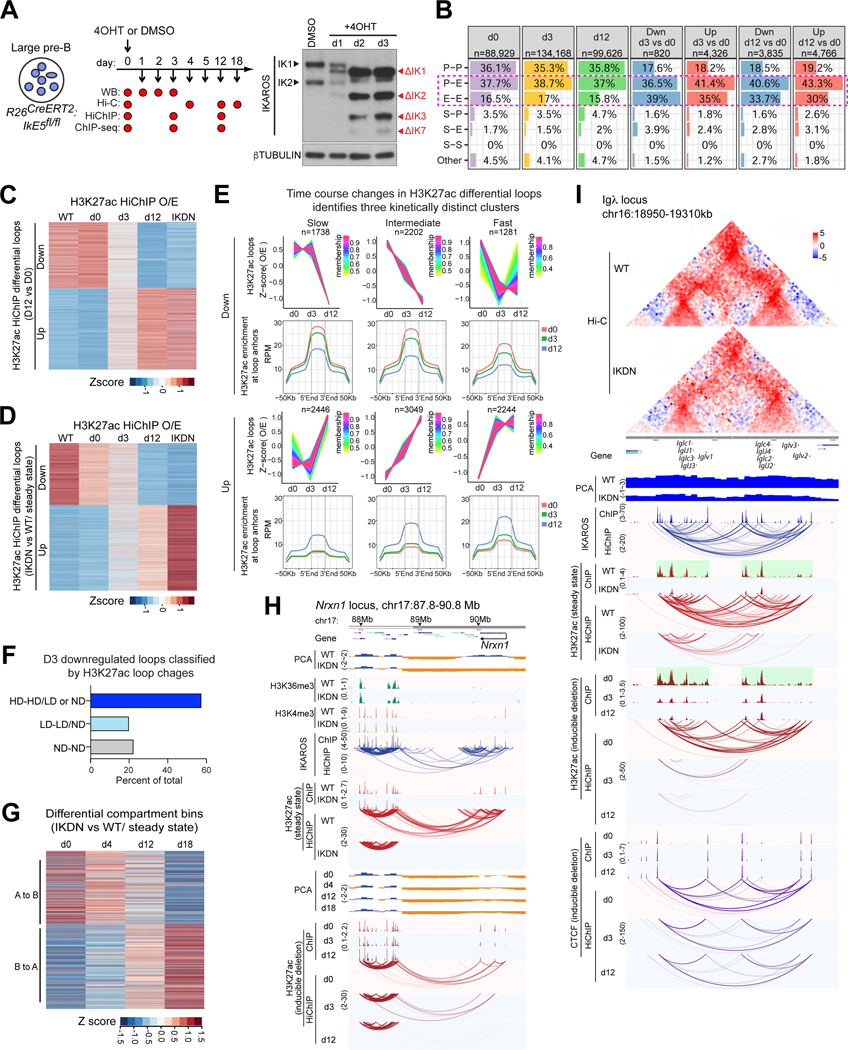
Figure 5. IKAROS maintains lineage-specific chromatin organization.
(A) Cultured large pre-B cells harvested at indicated time points after Cre-ERT2 induction and used for Hi-C, HiChIP and ChIP-seq. Detection of IKAROS WT (IK1, IK2) and mutant isoforms (ΔIK1, 2, 3, 7) is shown. (B) The number and percentage of loops (d0, d3, d12) and differential loops identified by H3K27ac HiChIP (d3 vs. d0 and d12 vs. d0), stratified according to anchor classification. (C) Contact counts for the differential H3K27ac HiChIP loops identified after in vitro deletion (d12 vs d0) are displayed for d0, d3, d12 and for WT and IKDN (in vivo). (D) Contact counts for the differential H3K27ac HiChIP loops identified after in vivo deletion (WT vs. IKDN) displayed as in (C). (E) Sites of differential H3K27ac interactions identified in vivo analyzed after in vitro deletion and segregated into clusters of slow, intermediate, and fast changes in contact strength. Average H3K27ac enrichment at the loop anchors and flanking regions is shown across the time course for each group. (F) Downregulated H3K27ac loops at d3 classified according to change of H3K27ac ChIP-seq signal at their anchors (HD high difference, LD low difference, ND no difference). (G) Z-score transformed compartment scores derived from Hi-C data of d0-d18 after in vitro IKAROS deletion were plotted for the differential compartment bins identified in vivo. Positive z-scores = stronger euchromatic affiliation in WT. (H, I) Steady-state (WT, IKDN upper tracks) and in vitro deletion data (d0, d3, d12, lower tracks) are compared for the Nrxn1 (H) and Igλ (I) locus. Source: Tables S2-3, S6-7.

