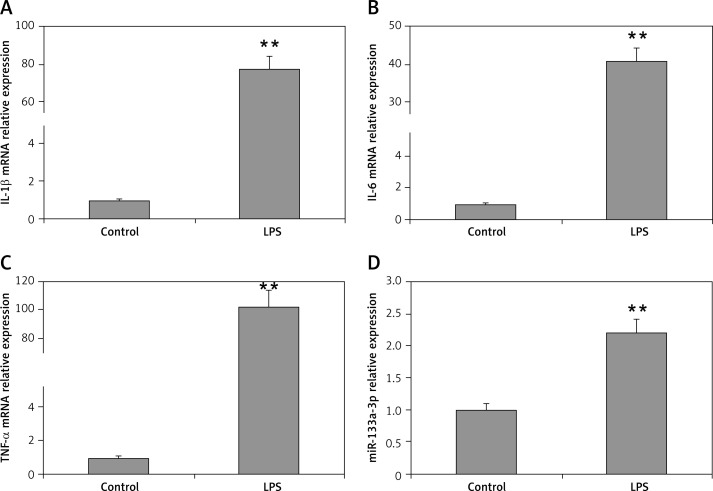
Figure 1.
Levels of proinflammatory cytokines and miR-133a-3p in alveolar macrophages after stimulation with LPS. A–C – RT-PCR evaluation showing relative mRNA levels of IL-1β, IL-6 and TNF-α in alveolar macrophages after stimulation with LPS. D – miR-133a-3p levels in alveolar macrophages after stimulation with LPS
The data presented show means ± SE (n = 6); **p = 0.01 versus control.

