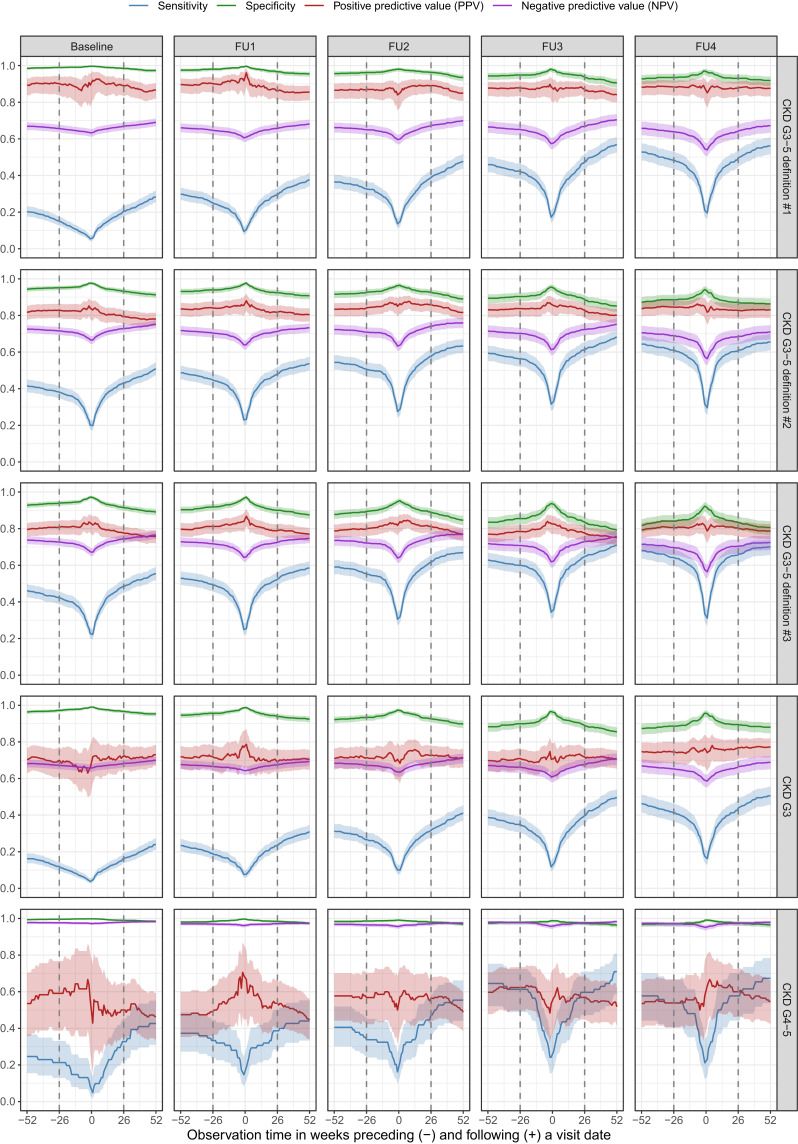
Figure 1.
Indicators of diagnostic validity (sensitivity, specificity, PPV, and NPV) of different CKD stages and claims-based definitions using weekly thresholds from one year preceding to one year following a study visit as observation time for claims data diagnoses. Dashed lines represent the observation time window for the main analysis of ± 6 months. Shades represent 95% confidence intervals and are interpolated for graphical display. Included ICD-10-GM diagnoses for each stage and definition are presented in Table 2.

