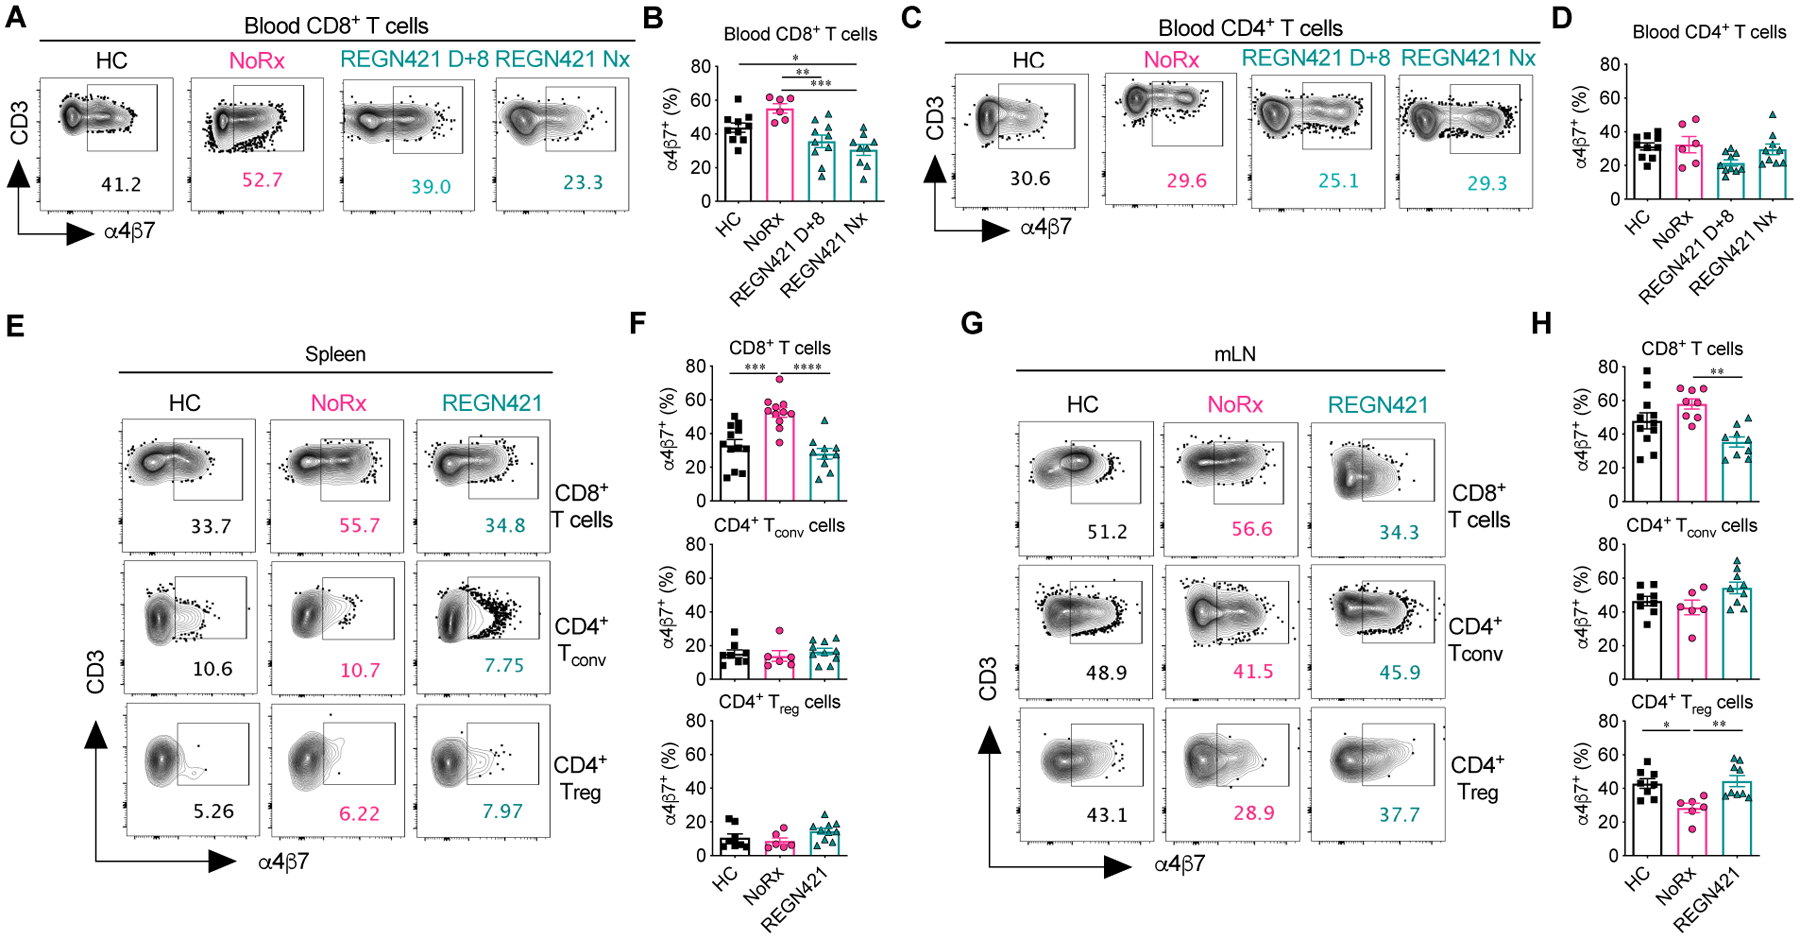
Figure 3. DLL4 blockade prevents T cell expression of the gut-homing α4β7 integrin during GVHD.

(A to D) Representative flow cytometry plots (A and C) and data (B and D) depicting the frequency of α4β7+CD8+ (A and B) and α4β7+CD4+ T cells (C and D) in the blood of healthy controls (HC; n=10) and allo-HCT recipients from the NoRx aGVHD (n=6) and REGN421 (n=10) cohorts. Data from the REGN421 cohort was collected at terminal analysis and day +8 (time-matched with the NoRx cohort). (E to H) Representative flow cytometry plots (E and G) and data (F and H) depicting the frequency of α4β7+CD8+, α4β7+CD4+ Tconv and α4β7+CD4+ Treg cells in spleen and mesenteric lymph nodes (mLN) of healthy controls (n=8 to 12 depending on the organ) versus allo-HCT recipients from the NoRx (n=8 to 11 depending on the organ) or REGN421 (n=10) experimental cohorts. For all plots: *p<0.05, **p<0.01, ***p<0.001, ***p<0.001, ****p<0.0001, one-way ANOVA with Tukey post-hoc test.
